library(dlm)
data(Nile)
library(cmdstanr)
## This is cmdstanr version 0.5.3
## - CmdStanR documentation and vignettes: mc-stan.org/cmdstanr
## - CmdStan path: /usr/local/cmdstan
## - CmdStan version: 2.32.2
knitr::knit_engines$set(stan = cmdstanr::eng_cmdstan)
library(coda)Stanには、状態空間モデルの1種であるガウシアン動的線形モデル用のgaussian_dlm_obsという分布が用意されています。これを利用して状態空間モデルのあてはめをやってみます。
モデル
ローカルトレンドモデルをあてはめます。
観測サブモデルです。
\[ y_t = \left(\begin{array}{cc} 1 & 0 \end{array}\right) \left(\begin{array}{c} \theta_{1,t} \\ \theta_{2,t} \end{array}\right) + v_t \]
状態サブモデルです。
\[ \left(\begin{array}{c} \theta_{1,t} \\ \theta_{2,t} \end{array}\right) = \left(\begin{array}{cc} 1 & 1 \\ 0 & 1 \end{array}\right)\left(\begin{array}{c} \theta_{1,t-1} \\ \theta_{2,t-1} \end{array}\right) + \left(\begin{array}{c} w_{1,t} \\ w_{2,t} \end{array}\right) \]
データ
ナイル川のデータを利用します。
Stanモデル
Stanのモデルです。コンパイルして、model1というオブジェクトに格納しておきます。modelブロックでgaussian_dlm_obs分布を使用しています。これで、各サブモデル中の分散を推定します。
// state spece model using gaussian_dlm_obs
data {
  int<lower=0> T;  // number of observations
  matrix[1, T] Y;  // observation
  matrix[2, 1] F;  // design matrix
  matrix[2, 2] G;  // transition matrix
  vector[2] m0;    // mean of the initial state
  matrix[2, 2] C0; // covariance matrix of the initial state
}

parameters {
  array[3] real<lower=0> s2; // variances
}

transformed parameters {
  cov_matrix[1] V = [[s2[1]]]; // observation covariance matrix
  cov_matrix[2] W = [[s2[2], 0], [0, s2[3]]];; // system covariance matrix
}

model {
  Y ~ gaussian_dlm_obs(F, G, V, W, m0, C0);
}
Stanのモデルに与えるデータを用意します。
FF <- matrix(c(1, 0), nrow = 2, ncol = 1)
GG <- matrix(c(1, 0, 1, 1), nrow = 2, ncol = 2)
m0 <- c(0, 0)
C0 <- matrix(c(1.0e+7, 0, 0, 1.0e+7), nrow = 2, ncol = 2)
あてはめ
CmdStanRを利用して、RからCmdStanを実行します。
set.seed(1)

stan_data <- list(T = length(Nile), Y = matrix(Nile, nrow = 1),
                  F = FF, G = GG, m0 = m0, C0 = C0)
fit1 <- model1$sample(data = stan_data,
                      chains = 4, parallel_chains = 4,
                      iter_warmup = 1000, iter_sampling = 1000,
                      refresh = 0)
## Running MCMC with 4 parallel chains...
##
## Chain 2 finished in 7.5 seconds.
## Chain 1 finished in 7.7 seconds.
## Chain 3 finished in 7.7 seconds.
## Chain 4 finished in 7.9 seconds.
##
## All 4 chains finished successfully.
## Mean chain execution time: 7.7 seconds.
## Total execution time: 8.0 seconds.
結果
モデル中の分散共分散行列のVとW(Vはこのモデルではスカラーですが)の事後平均を取り出します。
V <- fit1$summary("V") |>
  dplyr::pull("mean")
W <- fit1$summary("W") |>
  dplyr::pull("mean") |>
matrix(2, 2)モデル中の分散の事後分布の要約を表示します(こちらはs2の方で表示してみます)。
fit1$print("s2")
##  variable     mean   median      sd     mad      q5      q95 rhat ess_bulk
##     s2[1] 13870.96 13599.60 3297.13 3170.61 8799.90 19462.69 1.00     2199
##     s2[2]  3851.54  3229.32 2775.36 2374.09  579.63  9254.79 1.00     1783
##     s2[3]    40.52    16.98   68.81   20.72    0.85   156.94 1.00     2669
##  ess_tail
##      1935
##      1153
## 2274観測モデルの分散です。s2[1]の平均と同じです。
print(V)
## [1] 13870.96状態モデルの分散共分散行列です。対角成分がs2[2]とs2[3]に対応します。
print(W)
## [,1] [,2]
## [1,] 3851.542 0.00000
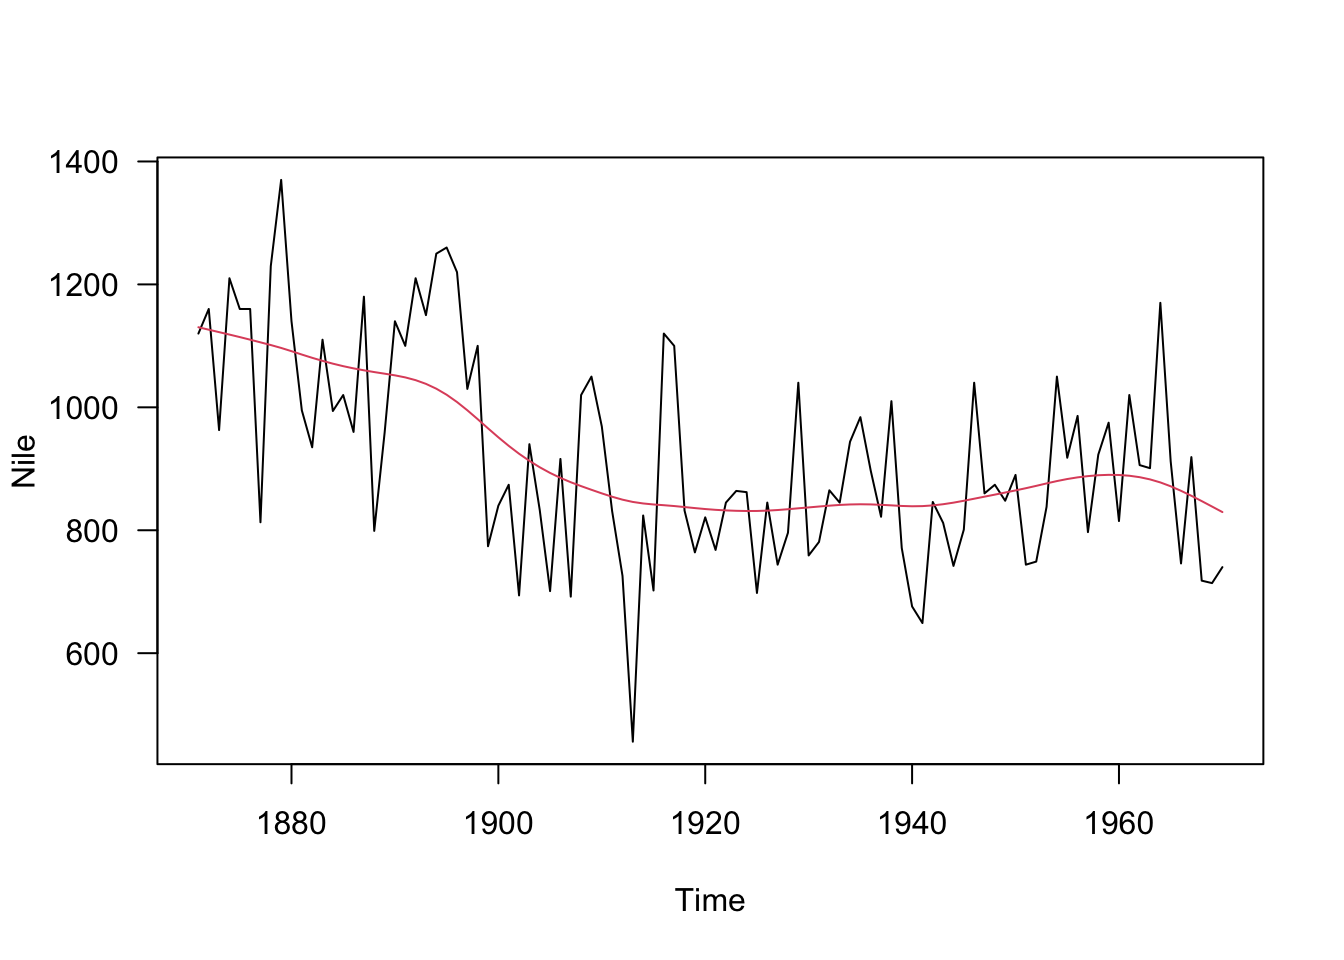
## [2,] 0.000 40.52436dlmパッケージの関数を利用して、平滑化曲線を描画します。
BuildNile <- function(dV, dW) {
  dlmModPoly(order = 2, dV = dV, dW = dW)
}
smoothNile <- dlmSmooth(Nile, BuildNile(V, diag(W)))
plot(Nile, las = 1)
lines(ts(smoothNile$s[-1, 1], start = 1871),
      col = 2)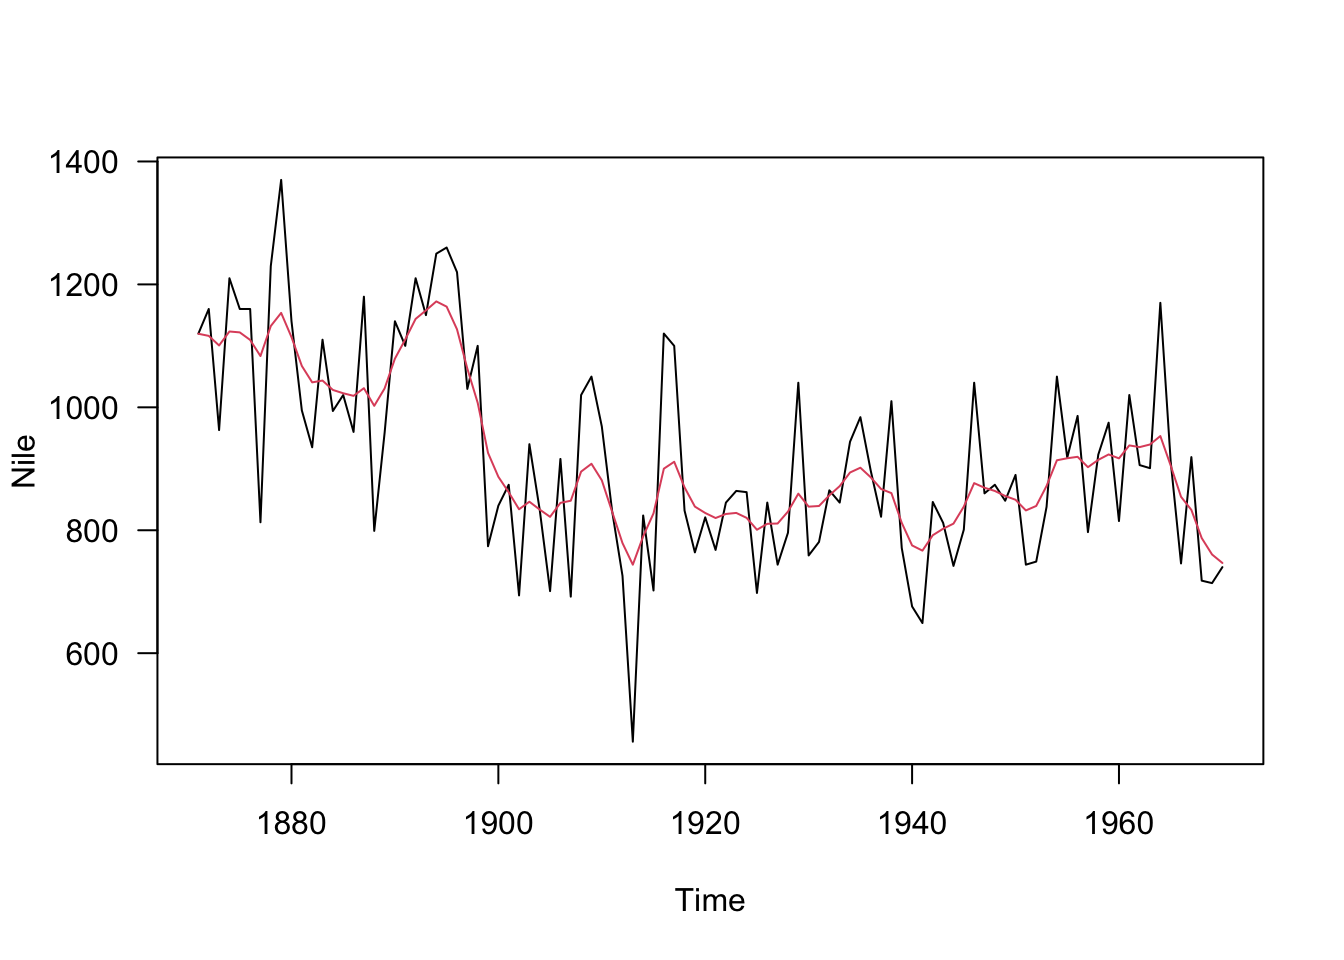
gaussian_dlm_obsを使わないモデル
比較のため、gaussian_dlm_obsを使わずに、状態空間モデルをStanでモデル化してみます。以下のようなローカルトレンドモデルをあてはめます。基本的には前のモデルと等価ですが、状態モデル中の分散が1個になっているところが異なります。
\[ y_t \sim \mathrm{Normal}(\theta_t, \sigma_1^2) \]
\[ \theta_t \sim \mathrm{Normal}(2\theta_{t - 1} - \theta_{t-2}, \sigma_2^2),\, t \in \{3, 4, \dots, T\} \]
コンパイルしたモデルをmodel2というオブジェクトに格納しておきます。
// state space model
data {
  int<lower=0> T;  // number of observations
  vector[T] Y;  // observation
}

parameters {
  vector[T] theta; // latent state
  array[2] real<lower=0> sigma; // standard deviations
}

model {
  Y ~ normal(theta, sigma[1]);
  theta[1:2] ~ normal(0, sqrt(10^7));
  theta[3:T] ~ normal(2 * theta[2:(T - 1)] - theta[1:(T - 2)], sigma[2]);
  sigma ~ normal(0, 100);
}
あてはめ
あてはめます。キャッシュのため、outputディレクトリに出力のCSVファイルを保存するようにしています。
set.seed(1)

stan_data <- list(T = length(Nile), Y = Nile)
fit2 <- model2$sample(data = stan_data,
                      chains = 4, parallel_chains = 4,
                      iter_warmup = 5000, iter_sampling = 10000,
                      refresh = 0,
                      max_treedepth = 15,
                      output_dir = "output")
## Running MCMC with 4 parallel chains...
## Chain 1 Informational Message: The current Metropolis proposal is about to be rejected because of the following issue:
## Chain 1 Exception: normal_lpdf: Scale parameter is 0, but must be positive! (in '/var/folders/n_/mzbh35w12lg8q9gjzg9mq0lr0000gn/T/RtmpTcNqvV/model-5e6a5f7af1ca.stan', line 12, column 2 to column 73)
## Chain 1 If this warning occurs sporadically, such as for highly constrained variable types like covariance matrices, then the sampler is fine,
## Chain 1 but if this warning occurs often then your model may be either severely ill-conditioned or misspecified.
## Chain 1
## Chain 3 finished in 72.7 seconds.
## Chain 1 finished in 93.7 seconds.
## Chain 2 finished in 101.6 seconds.
## Chain 4 finished in 133.5 seconds.
##
## All 4 chains finished successfully.
## Mean chain execution time: 100.4 seconds.
## Total execution time: 133.6 seconds.
## Warning: 87 of 40000 (0.0%) transitions ended with a divergence.
## See https://mc-stan.org/misc/warnings for details.
## Warning: 4 of 4 chains had an E-BFMI less than 0.2.
## See https://mc-stan.org/misc/warnings for details.
結果
モデル中の標準偏差の事後分布の要約を表示します。
fit2$print("sigma")
##  variable   mean median    sd   mad     q5    q95 rhat ess_bulk ess_tail
##  sigma[1] 135.57 135.08 10.46 10.27 119.21 153.56 1.00     2680     5989
## sigma[2] 3.78 2.66 3.37 1.96 0.88 10.47 1.01 136 293sigma[2]の有効サンプルサイズが小さいようなので、as_mcmc.list関数で、CmdStanMCMC形式のfit2オブジェクトを、mcmc.list形式に変換して、MCMCの軌跡と密度を表示してみます。
fit2.mcmc <- as_mcmc.list(fit2)
plot(fit2.mcmc[, "sigma[2]"])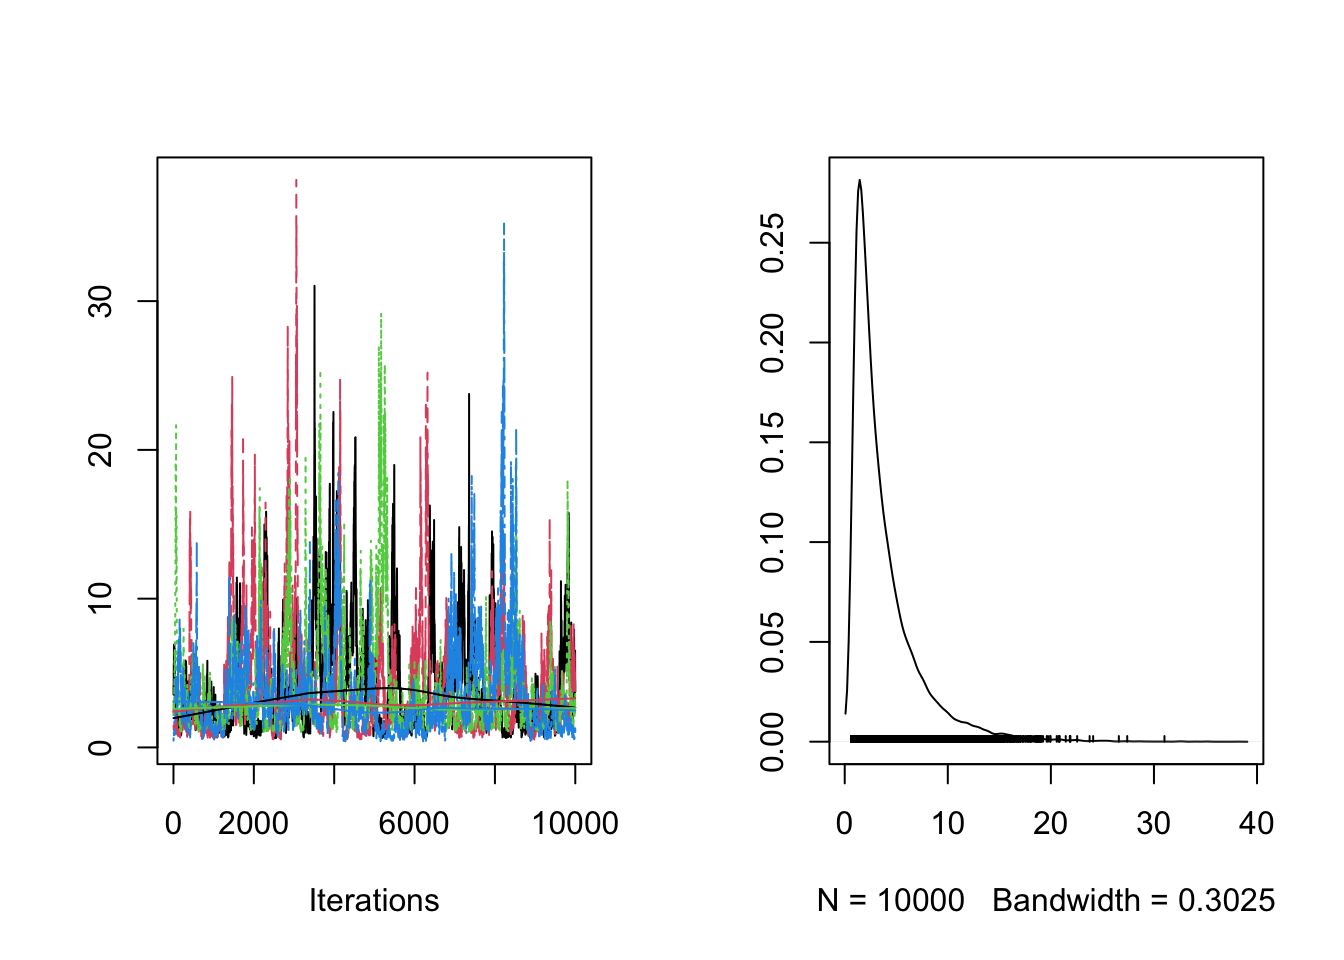
大丈夫そうなので、状態thetaを取り出して、元のデータに重ねてプロットします。前のモデルよりもより滑らかになりました。
theta <- fit2$summary("theta") |>
  dplyr::pull("mean")
plot(Nile, las = 1)
lines(ts(data = theta, start = start(Nile), end = end(Nile)), col = 2)