library(AHMbook)
library(nimble)
## nimble version 0.13.1 is loaded.
## For more information on NIMBLE and a User Manual,
## please visit https://R-nimble.org.
##
## Note for advanced users who have written their own MCMC samplers:
##   As of version 0.13.0, NIMBLE's protocol for handling posterior
##   predictive nodes has changed in a way that could affect user-defined
##   samplers in some situations. Please see Section 15.5.1 of the User Manual.
##
##  次のパッケージを付け加えます: 'nimble'
##  以下のオブジェクトは 'package:stats' からマスクされています:
##
##     simulate
library(ggplot2)

set.seed(123)
ch_data <- simCJS(
  n.occ = 6,
  n.marked = 20,
  phi = 0.7,
  p = 0.4,
show.plot = FALSE)動物の捕獲・再捕獲データに、Cormack-Jolly-Seber (CJS)モデルを適用して、(見かけの)生存率と、再捕獲率を推定します。CJSモデルについては、BUGSで学ぶ階層モデリング入門や、Applied Hierarchical Modeling in Ecology Vol.2に解説があります。
データの取り方としては、トラップで動物を捕獲し、個体識別のためマーキングして放すという調査を複数回おこないます。次回以降の調査でマーキングした個体が再捕獲されたら、それを記録して再び放します。こうして作成した捕獲履歴をデータとして解析をおこないます。ただし、永続的な移出と死亡とは区別できないので「見かけの」生存率を推定することになります。
模擬データの生成
RのAHMbookパッケージにあるsimOcc()関数をつかって、CJSモデルのための模擬データを生成します。設定は以下のとおりです。ここでは最も単純なモデルとするため、見かけの生存率と再捕獲率は一定としています。
- 調査回数(時間): 6
- 1回の調査でマーキングする個体数: 20
- 見かけの生存率 : 0.7
- 再捕獲率: 0.4
データの確認
データの最初と最後を確認します。
head(ch_data$ch)
##      [,1] [,2] [,3] [,4] [,5] [,6]
## [1,]    1    1    0    0    0    0
## [2,]    1    0    0    0    0    0
## [3,]    1    1    1    1    0    0
## [4,]    1    0    0    0    0    0
## [5,]    1    0    0    0    0    0
## [6,] 1 1 1 0 0 0tail(ch_data$ch)
## [,1] [,2] [,3] [,4] [,5] [,6]
## [95,] 0 0 0 0 1 0
## [96,] 0 0 0 0 1 1
## [97,] 0 0 0 0 1 1
## [98,] 0 0 0 0 1 0
## [99,] 0 0 0 0 1 0
## [100,] 0 0 0 0 1 1マーキングするのは5回目の調査までです。1が発見(捕獲または再捕獲)、0が不発見(あるい最初の捕獲前)を示します。
マーキングされた個体で実際に生存している個体の数と、発見された個体の数をプロットしてみます。
data.frame(Time = rep(1:6, 2),
           Number = c(ch_data$n.alive, apply(ch_data$ch, 2, sum)),
           Data = rep(c("alive", "capture"), each = 6)) |>
  ggplot(aes(x = Time, y = Number, colour = Data)) +
  geom_line() +
  ylim(0, NA)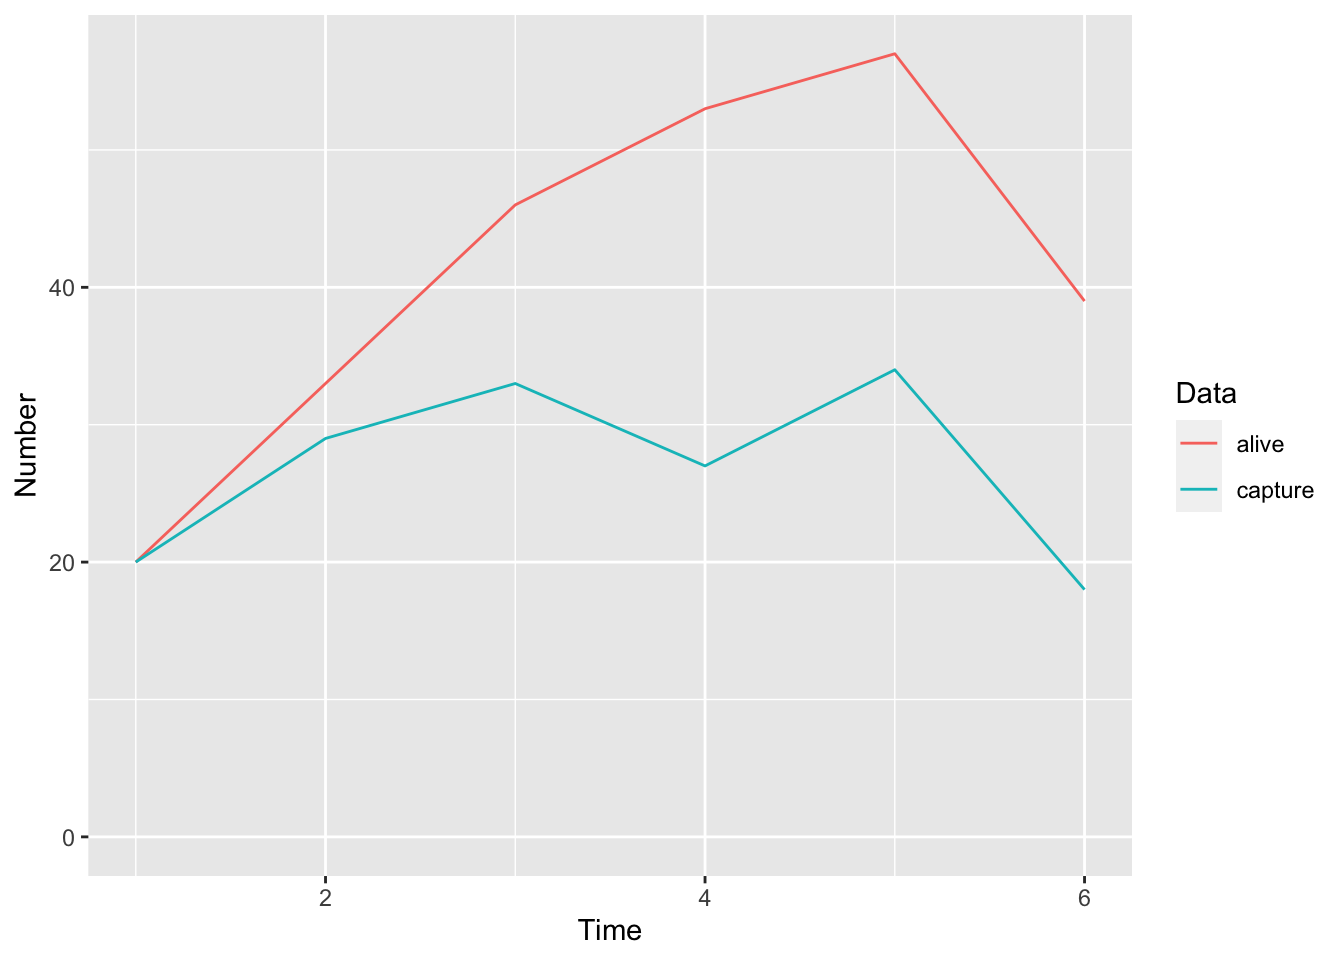
モデル
モデルです。BUGSコードをNIMBLEで扱います。状態空間モデルとして実装されています。
- 定数
N: 個体数T: 調査回数F[n]:n番目の個体が最初に捕獲された調査回
- データ
ch[n, t]: 捕獲履歴
- パラメータ
phi: 生存率p: 再捕獲率z[n, t]: 潜在状態(0: 死亡, 1: 生存, 最初の捕獲後のみ)
mc <- nimbleCode({
  for (n in 1:N) {
    # latent state at the first capture
    z[n, F[n]] <- 1
    for (t in (F[n] + 1):T) {
      # system model
      z[n, t] ~ dbern(phi * z[n, t - 1])
      # observation model
      ch[n, t] ~ dbern(p * z[n, t])
    }
  }
  # priors
  phi ~ dunif(0, 1)
  p ~ dunif(0, 1)
})
あてはめ
NIMBLEであてはめます。
nimble_const <- list(N = ch_data$n.ind,
                     T = ch_data$n.occ,
                     F = ch_data$f)
nimble_data <- list(ch = ch_data$ch)
nimble_init <- function() {
  list(phi = runif(1, 0, 1),
       p = runif(1, 0, 1),
       z = matrix(1, nrow = ch_data$n.ind, ncol = ch_data$n.occ))}
nimble_fit <- nimbleMCMC(code = mc,
                         constants = nimble_const,
                         data = nimble_data,
                         inits = nimble_init,
                         monitors = c("phi", "p"),
                         niter = 8000,
                         nburnin = 4000,
                         nchains = 3,
                         setSeed = 1:3,
                         summary = TRUE)
## Defining model
## Building model
## Setting data and initial values
## Running calculate on model
##   [Note] Any error reports that follow may simply reflect missing values in model variables.
## Checking model sizes and dimensions
##   [Note] This model is not fully initialized. This is not an error.
##          To see which variables are not initialized, use model$initializeInfo().
##          For more information on model initialization, see help(modelInitialization).
## Checking model calculations
## Compiling
##   [Note] This may take a minute.
##   [Note] Use 'showCompilerOutput = TRUE' to see C++ compilation details.
## running chain 1...
## |-------------|-------------|-------------|-------------|
## |-------------------------------------------------------|
## running chain 2...
## |-------------|-------------|-------------|-------------|
## |-------------------------------------------------------|
## running chain 3...
## |-------------|-------------|-------------|-------------|
## |-------------------------------------------------------|
結果
結果です。
nimble_fit$summary$all.chains
##          Mean    Median    St.Dev. 95%CI_low 95%CI_upp
## p   0.4233152 0.4218532 0.06359199 0.3032427 0.5567318
## phi 0.7060248 0.7051553 0.05521333 0.6026594 0.8178781
設定したパラメータの値をだいたい再現できました。