library(Rcpp)
library(inline)
##
##  次のパッケージを付け加えます: 'inline'
##  以下のオブジェクトは 'package:Rcpp' からマスクされています:
##
## registerPluginRで、マンデルブロ集合を描画してみます。Rだけではさすがにおそいので、計算部分ではC++を使います。
準備
Rcppパッケージとinlineパッケージを使用します。
C++のコードです。文字列として、mandelbrot.srcに格納しています。
mandelbrot.src <- "
Rcpp::NumericVector x(xx);
Rcpp::NumericVector y(yy);
unsigned short t = Rcpp::as<unsigned short>(threshold);
int nx = x.size(), ny = y.size();
Rcpp::NumericVector u(nx);

if (nx != ny) {
  return Rcpp::wrap(-1);
} else {
  for (int i = 0; i < nx; i++) {
    std::complex<double> z(0.0, 0.0);
    std::complex<double> c(x[i], y[i]);
    unsigned short k = 0;

    while (k < t) {
      z = z * z + c;
      if (abs(z) > 2.0) break;
      k++;
    }
    u[i] = k;
  }
  return Rcpp::wrap(u);
}
"rcpp関数で、Rの関数とします。
mandelbrot.c <- rcpp(sig = signature(xx = "numeric",
                                     yy = "numeric",
                                     threshold = "numeric"),
                     body = mandelbrot.src,
includes = "#include <complex>")マンデルブロ集合を描画する関数を定義します。最初の4つの引数を値が描画範囲です。px ,py引数で、X軸とY軸のピクセル数をそれぞれ指定します。threshold引数で、計算回数の上限の値を、col引数でカラーパレットを指定します。
mandelbrot <- function(min.x = -2, max.x = 1, min.y = -1.5, max.y = 1.5,
                       px = 256,
                       py = round((max.y - min.y) / (max.x - min.x) * px),
                       threshold = 255,
                       col = terrain.colors(threshold + 1)) {
  if (min.x > max.x) {
    a <- min.x
    min.x <- max.x
    max.x <- a
  }
  if (min.y > max.y) {
    a <- min.y
    min.y <- max.y
    max.y <- a
  }
  if (px < 0) px <- -px
  if (py < 0) py <- -py

  rx <- seq(min.x, max.x, length = px)
  ry <- seq(min.y, max.y, length = py)
  xx <- rep(rx, py)
  yy <- rep(ry, each = px)

  z <- mandelbrot.c(xx, yy, threshold)
  matz <- matrix(z, nrow = px)
  image(seq(min.x, max.x, length = nrow(matz)),
        seq(min.y, max.y, length = ncol(matz)),
        matz,
        col = col,
        xlab = "x", ylab = "y", asp = 1.0)
}
実行例
実行例です。
mandelbrot(min.x = -2, max.x = 1,
           min.y = -1.5, max.y = 1.5,
           px = 640, py = 640,
           threshold = 255,
           col = heat.colors(256))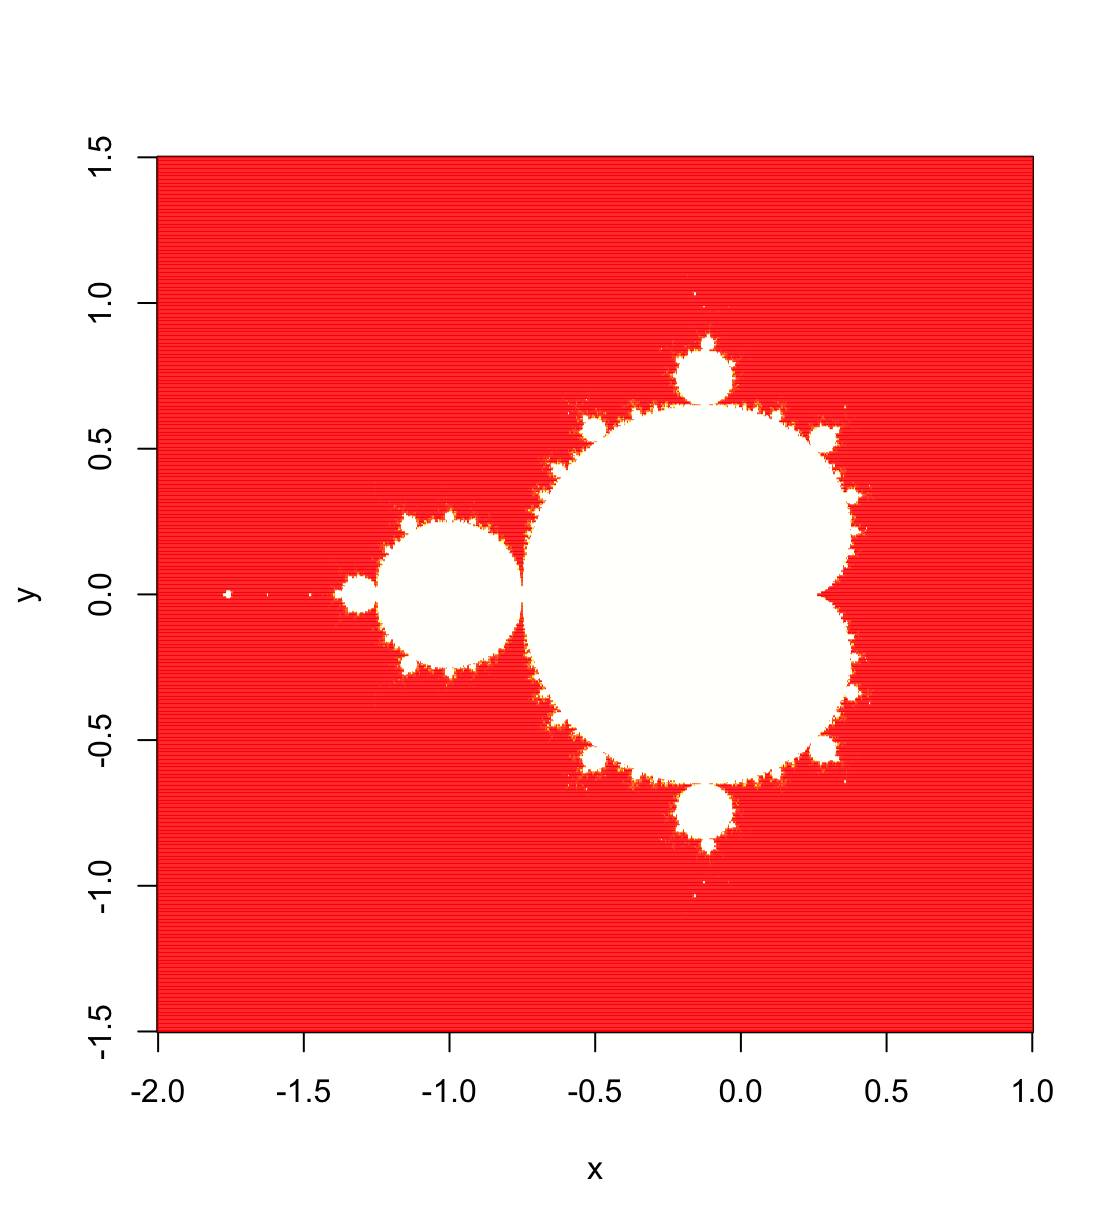
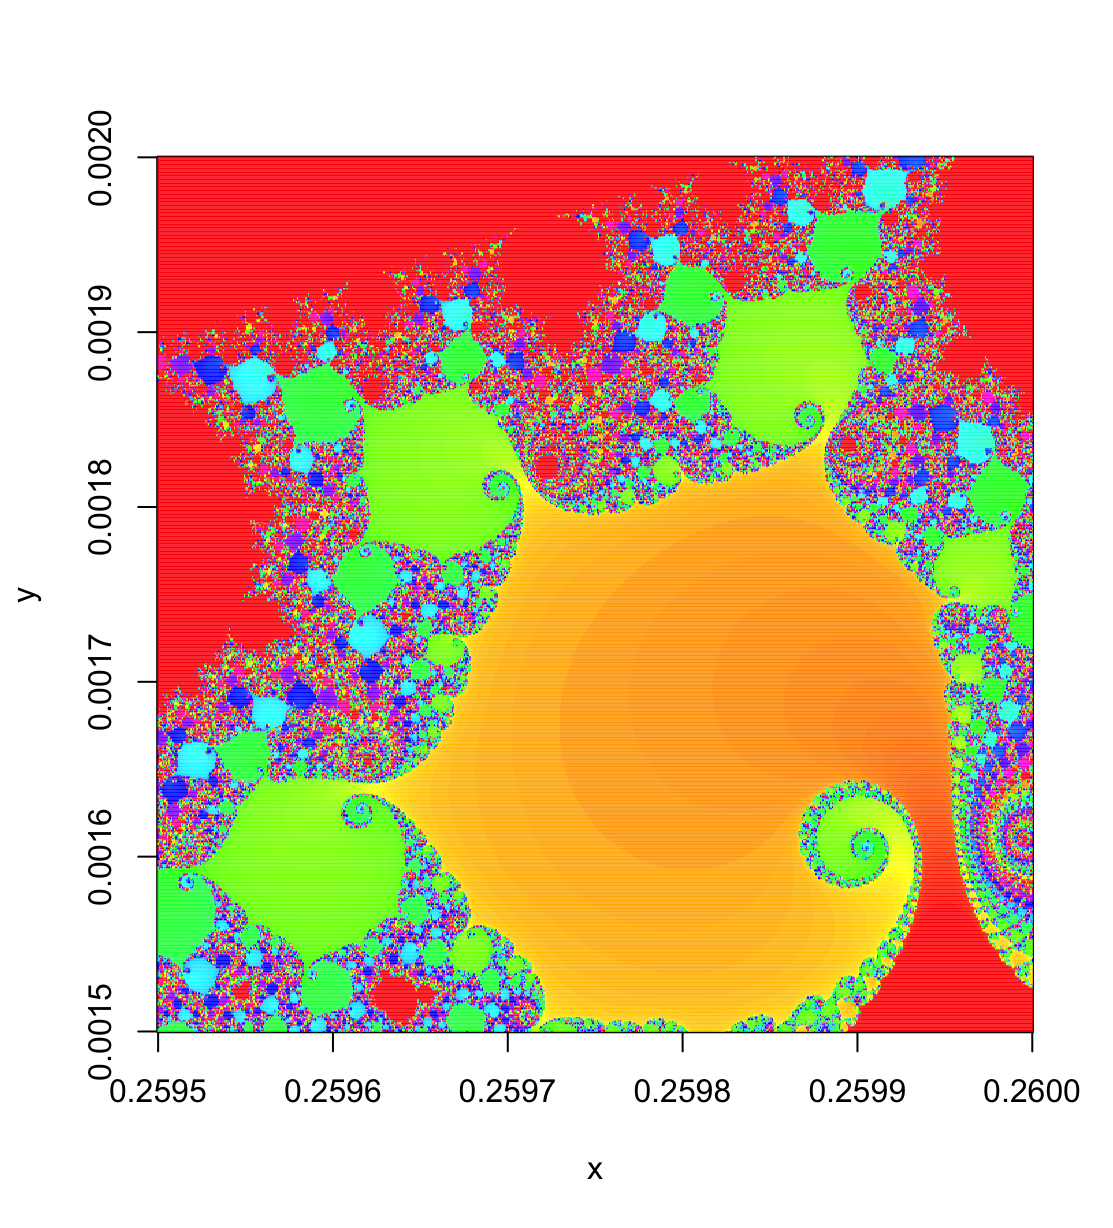
描画範囲とカラーパレットを変えてみます。
mandelbrot(min.x = 0.2595, max.x = 0.2600,
           min.y = 0.0015, max.y = 0.0020,
           px = 640, py = 640,
           threshold = 1023,
           col = rep(rainbow(256), (1023 + 1) / 256))