library(DiagrammeR)
library(GGally)
##  要求されたパッケージ ggplot2 をロード中です
## Registered S3 method overwritten by 'GGally':
##   method from
##   +.gg   ggplot2
library(lavaan)
## This is lavaan 0.6-16
## lavaan is FREE software! Please report any bugs.
set.seed(1234)林・黒木(2016)にある、交絡および中間変数によるバイアスをシミュレーションで確認してみました。
- 林岳彦・黒木学 (2016) 相関と因果と丸と矢印のはなし—はじめてのバックドア基準—. 岩波データサイエンスVol.3: 28–48.
交絡
データ
以下のようなデータを用意しました。
N <- 200
beta1 <- c(0.7, 2, 0.5)

z <- rnorm(N, 0, 1)
x <- beta1[1] * z + rnorm(N, 0, 1)
y <- beta1[2] * x + beta1[3] * z + rnorm(N, 0, 2)
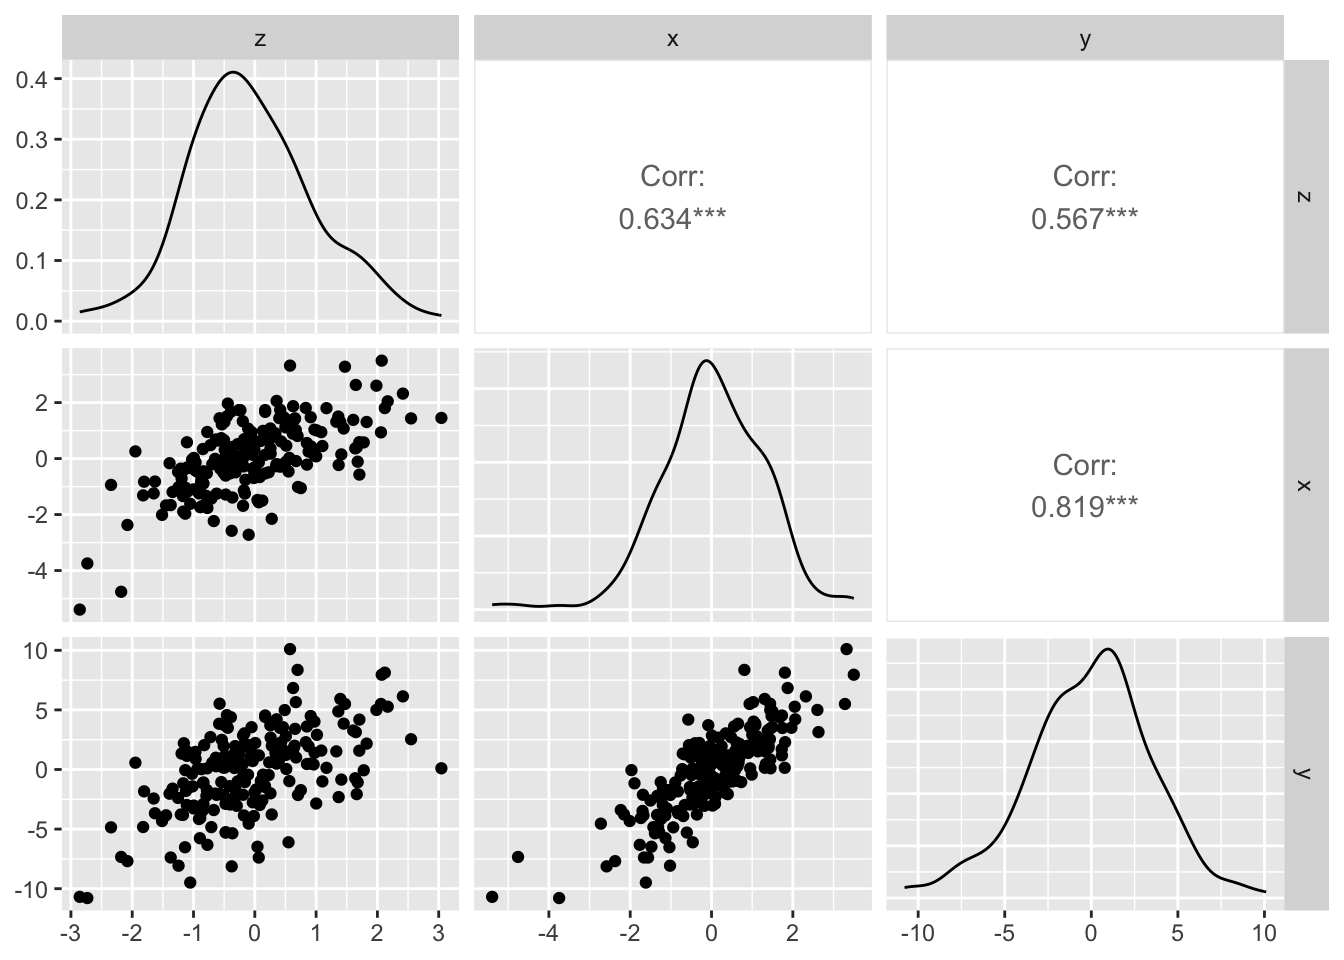
df1 <- data.frame(z = z, x = x, y = y)\(z\)が、\(x\)→\(y\)の関係の交絡因子になっています。

散布図行列をみてみます。
ggpairs(df1)
回帰
\(z\)を入れないで回帰してみます。
lm(y ~ x, data = df1) |>
  summary()
##
## Call:
## lm(formula = y ~ x, data = df1)
##
## Residuals:
##     Min      1Q  Median      3Q     Max
## -5.6237 -1.4965 -0.0608  1.3693  6.7193
##
## Coefficients:
##             Estimate Std. Error t value Pr(>|t|)
## (Intercept)  -0.1964     0.1459  -1.346     0.18
## x             2.2695     0.1129  20.106   <2e-16 ***
## ---
## Signif. codes:  0 '***' 0.001 '**' 0.01 '*' 0.05 '.' 0.1 ' ' 1
##
## Residual standard error: 2.062 on 198 degrees of freedom
## Multiple R-squared:  0.6712, Adjusted R-squared:  0.6696
## F-statistic: 404.3 on 1 and 198 DF,  p-value: < 2.2e-16
真値の2からずれるようです。
シミュレーション
1回だけではよくわからないので、2000回繰り返してみます。
fun1 <- function(N = 100, beta) {
  z <- rnorm(N, 0, 1)
  x <- beta1[1] * z + rnorm(N, 0, 1)
  y <- beta[2] * x + beta[3] * z + rnorm(N, 0, 2)
  coef1x <- coef(lm(y ~ x))["x"]
  coef2x <- coef(lm(y ~ x + z))["x"]
  c(coef1x, coef2x)
}

coef1 <- replicate(2000, fun1(N = 200, beta = beta1))
summary(coef1[1, ])
##    Min. 1st Qu.  Median    Mean 3rd Qu.    Max.
##   1.758   2.146   2.226   2.231   2.313   2.674
summary(coef1[2, ])
##    Min. 1st Qu.  Median    Mean 3rd Qu.    Max.
## 1.434 1.903 1.997 1.999 2.094 2.511記事にあるように、\(z\)を説明変数に入れないと、\(x\)の係数が、\(\beta_{Z,Y} \frac{\mathrm{cov}(X,Z)}{\mathrm{var}(X)}\)だけずれます。
中間変数
データ
以下のようなデータを用意しました。
beta2 <- c(0.7, 2, 0.5)

x <- rnorm(N, 0, 1)
z <- beta2[1] * x + rnorm(N, 0, 1)
y <- beta2[2] * x + beta2[3] * z + rnorm(N, 0, 2)
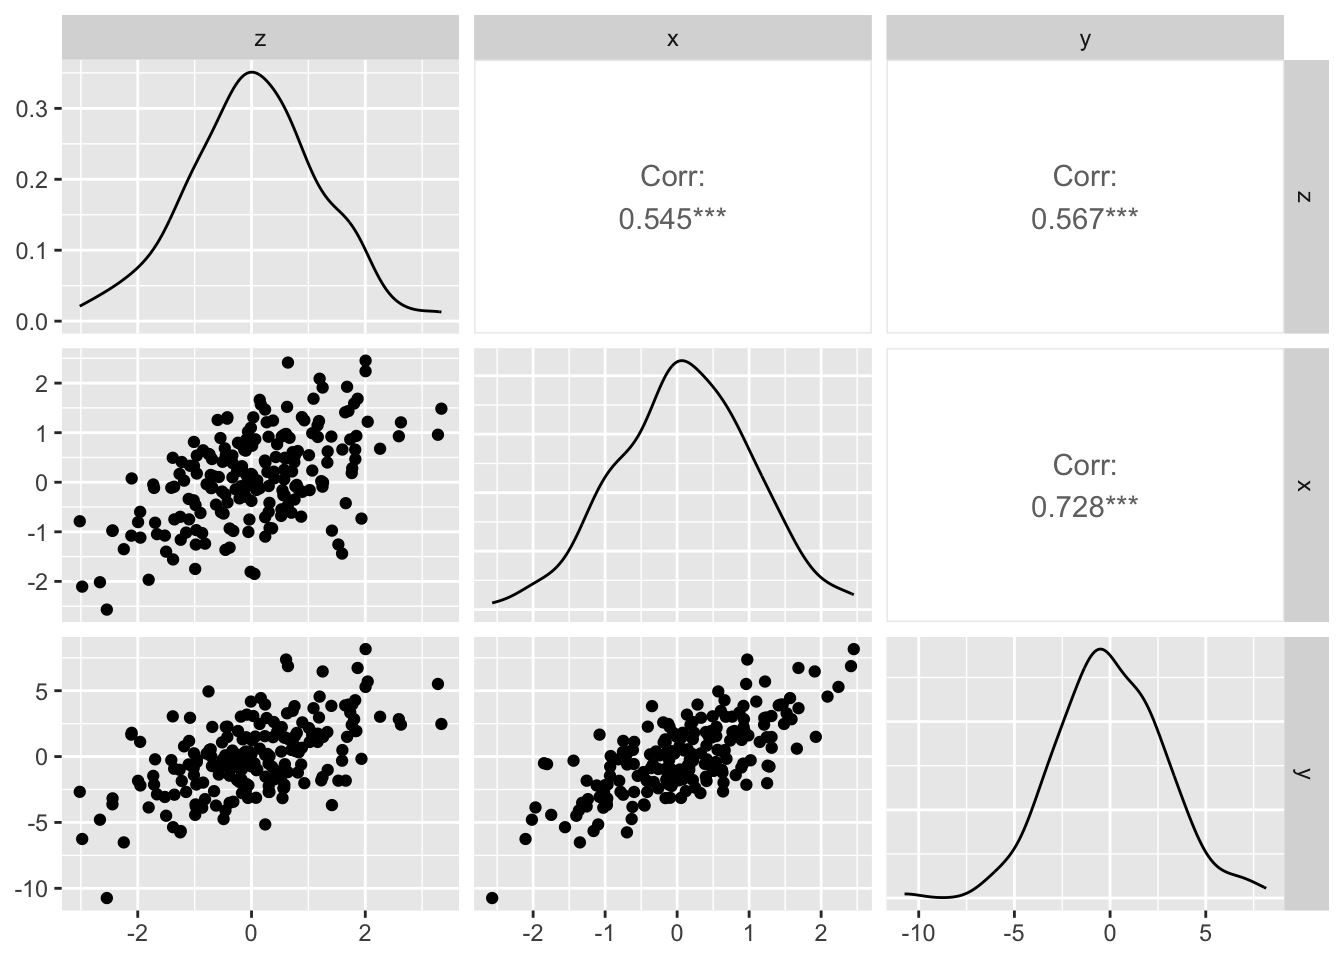
df2 <- data.frame(z = z, x = x, y = y)\(z\)が、\(x\)→\(y\)の関係の中間変数になっています。

散布図行列をみてみます。
ggpairs(df2)
回帰
\(x\)が\(y\)におよぼす効果は、2+0.7×0.5=2.35となります。
中間変数の\(z\)を入れて回帰してみます。
lm(y ~ x + z, data = df2) |>
  summary()
##
## Call:
## lm(formula = y ~ x + z, data = df2)
##
## Residuals:
##     Min      1Q  Median      3Q     Max
## -4.6416 -1.3156  0.1145  1.0189  5.4368
##
## Coefficients:
##             Estimate Std. Error t value Pr(>|t|)
## (Intercept)  -0.2121     0.1332  -1.593    0.113
## x             1.8296     0.1705  10.733  < 2e-16 ***
## z             0.5875     0.1349   4.356 2.13e-05 ***
## ---
## Signif. codes:  0 '***' 0.001 '**' 0.01 '*' 0.05 '.' 0.1 ' ' 1
##
## Residual standard error: 1.872 on 197 degrees of freedom
## Multiple R-squared:  0.5719, Adjusted R-squared:  0.5675
## F-statistic: 131.6 on 2 and 197 DF,  p-value: < 2.2e-16
当然ながら、偏回帰係数の2が求まります。
シミュレーション
中間変数\(z\)を説明変数に入れない場合と、入れた場合とを比較して見ます。2000回の繰り返しです。
fun2 <- function(N = 100, beta) {
  x <- rnorm(N, 0, 1)
  z <- beta[1] * x + rnorm(N, 0, 1)
  y <- beta[2] * x + beta[3] * z + rnorm(N, 0, 2)
  coef1x <- coef(lm(y ~ x))["x"]
  coef2x <- coef(lm(y ~ x + z))["x"]
  c(coef1x, coef2x)
}

coef2 <- replicate(2000, fun2(N = 200, beta = beta2))
summary(coef2[1, ])
##    Min. 1st Qu.  Median    Mean 3rd Qu.    Max.
##   1.838   2.252   2.348   2.349   2.446   2.977
summary(coef2[2, ])
##    Min. 1st Qu.  Median    Mean 3rd Qu.    Max.
## 1.398 1.885 2.000 2.000 2.110 2.597\(z\)を説明変数に入れると、その\(x\)の効果は偏回帰係数の分だけになります。
パス解析
せっかくなので、パス解析もやってみました。データは、1回だけの回帰でそれぞれ用いたものです。
交絡
model1 = "
  x ~ beta_xz * z
  y ~ beta_yx * x + beta_yz * z
# indirect effect
  indirect_yz := beta_xz * beta_yx
# total effect
  total_yz := beta_yz + indirect_yz
"
fit1 <- sem(model1, data = df1)
summary(fit1)
## lavaan 0.6.16 ended normally after 1 iteration
##
##   Estimator                                         ML
##   Optimization method                           NLMINB
##   Number of model parameters                         5
##
##   Number of observations                           200
##
## Model Test User Model:
##
##   Test statistic                                 0.000
##   Degrees of freedom                                 0
##
## Parameter Estimates:
##
##   Standard errors                             Standard
##   Information                                 Expected
##   Information saturated (h1) model          Structured
##
## Regressions:
##                    Estimate  Std.Err  z-value  P(>|z|)
##   x ~
##     z       (bt_x)    0.805    0.069   11.599    0.000
##   y ~
##     x      (bt_yx)    2.129    0.144   14.743    0.000
##     z      (bt_yz)    0.281    0.183    1.536    0.125
##
## Variances:
##                    Estimate  Std.Err  z-value  P(>|z|)
##    .x                 0.998    0.100   10.000    0.000
##    .y                 4.161    0.416   10.000    0.000
##
## Defined Parameters:
##                    Estimate  Std.Err  z-value  P(>|z|)
##     indirect_yz       1.713    0.188    9.116    0.000
##     total_yz          1.994    0.205    9.745    0.000
このデータでは、x→yの係数は2.129と推定されました(乱数のため真値からすこしずれます)。
なお、z→yの間接効果は1.713、総合効果は1.994と推定されました。
中間変数
model2 = "
  z ~ beta_zx * x
  y ~ beta_yx * x + beta_yz * z
# indirect effect
  indirect_yx := beta_zx * beta_yz
# total effect
  total_yx := beta_yx + indirect_yx
"
fit2 <- sem(model2, data = df2)
summary(fit2)
## lavaan 0.6.16 ended normally after 1 iteration
##
##   Estimator                                         ML
##   Optimization method                           NLMINB
##   Number of model parameters                         5
##
##   Number of observations                           200
##
## Model Test User Model:
##
##   Test statistic                                 0.000
##   Degrees of freedom                                 0
##
## Parameter Estimates:
##
##   Standard errors                             Standard
##   Information                                 Expected
##   Information saturated (h1) model          Structured
##
## Regressions:
##                    Estimate  Std.Err  z-value  P(>|z|)
##   z ~
##     x       (bt_z)    0.688    0.075    9.184    0.000
##   y ~
##     x      (bt_yx)    1.830    0.169   10.814    0.000
##     z      (bt_yz)    0.588    0.134    4.389    0.000
##
## Variances:
##                    Estimate  Std.Err  z-value  P(>|z|)
##    .z                 0.963    0.096   10.000    0.000
##    .y                 3.451    0.345   10.000    0.000
##
## Defined Parameters:
##                    Estimate  Std.Err  z-value  P(>|z|)
##     indirect_yx       0.404    0.102    3.960    0.000
##     total_yx          2.234    0.149   15.037    0.000
このデータでは、総合効果は2.234と推定されました。