library(nimble)
## nimble version 1.0.1 is loaded.
## For more information on NIMBLE and a User Manual,
## please visit https://R-nimble.org.
##
## Note for advanced users who have written their own MCMC samplers:
##   As of version 0.13.0, NIMBLE's protocol for handling posterior
##   predictive nodes has changed in a way that could affect user-defined
##   samplers in some situations. Please see Section 15.5.1 of the User Manual.
##
##  次のパッケージを付け加えます: 'nimble'
##  以下のオブジェクトは 'package:stats' からマスクされています:
##
##     simulate
library(posterior)
## This is posterior version 1.4.1
##
##  次のパッケージを付け加えます: 'posterior'
##  以下のオブジェクトは 'package:stats' からマスクされています:
##
##     mad, sd, var
##  以下のオブジェクトは 'package:base' からマスクされています:
##
##     %in%, match
library(bayesplot)
## This is bayesplot version 1.10.0
## - Online documentation and vignettes at mc-stan.org/bayesplot
## - bayesplot theme set to bayesplot::theme_default()
##    * Does _not_ affect other ggplot2 plots
##    * See ?bayesplot_theme_set for details on theme setting
##
##  次のパッケージを付け加えます: 'bayesplot'
##  以下のオブジェクトは 'package:posterior' からマスクされています:
##
##     rhat
library(dplyr)
##
##  次のパッケージを付け加えます: 'dplyr'
##  以下のオブジェクトは 'package:stats' からマスクされています:
##
##     filter, lag
##  以下のオブジェクトは 'package:base' からマスクされています:
##
##     intersect, setdiff, setequal, union
library(ggplot2)
set.seed(123)前回のつづきで、今回は離散値の場合をあつかいます。
準備
今回はNIMBLEを使用します。
データ
ゼロ過剰ポアソン分布のデータを用意します。
N <- 100
p <- 0.7
lambda <- 2.5
z <- rbinom(N, 1, p)
Y <- rpois(N, z * lambda)
生成されたデータを確認します。
data.frame(Y = Y) |>
  ggplot() +
  geom_bar(aes(x = Y)) +
  scale_x_continuous(breaks = 0:max(Y), minor_breaks = NULL)
モデル1
まずは、ポアソン分布をあてはめてみます。
複製データyrepの生成は、観測値Yのポアソン分布へのあてはめと同じコードになります。
code1 <- nimbleCode({
  for (n in 1:N) {
    Y[n] ~ dpois(lambda)
    # replicated data
    yrep[n] ~ dpois(lambda)
  }
  # prior
  lambda ~ dunif(0, 100)
})
あてはめ
初期化の関数init_funを定義して、nimbleMCMCでモデルをあてはめ、MCMCサンプルを取得します。後の利用のためにMCMCサンプルをcodaパッケージのmcmc.list型で出力するようにしています。
init_fun1 <- function() {
  list(lambda = runif(1, 0, 2),
       yrep = rpois(N, 1))
}
fit1 <- nimbleMCMC(code = code1,
                   constants = list(N = N),
                   data = list(Y = Y),
                   inits = init_fun1,
                   monitors = c("lambda", "yrep"),
                   nchains = 3,
                   niter = 2000, nburnin = 1000,
                   samplesAsCodaMCMC = TRUE)
## Defining model
## Building model
## Setting data and initial values
## Running calculate on model
##   [Note] Any error reports that follow may simply reflect missing values in model variables.
## Checking model sizes and dimensions
## Checking model calculations
## Compiling
##   [Note] This may take a minute.
##   [Note] Use 'showCompilerOutput = TRUE' to see C++ compilation details.
## running chain 1...
## |-------------|-------------|-------------|-------------|
## |-------------------------------------------------------|
## running chain 2...
## |-------------|-------------|-------------|-------------|
## |-------------------------------------------------------|
## running chain 3...
## |-------------|-------------|-------------|-------------|
## |-------------------------------------------------------|パラメータlambdaについて結果の要約をみます。
fit1 |>
  as_draws() |>
  summarise_draws() |>
  filter(variable == "lambda")
## # A tibble: 1 × 10
##   variable  mean median    sd   mad    q5   q95  rhat ess_bulk ess_tail
##   <chr>    <num>  <num> <num> <num> <num> <num> <num>    <num>    <num>
## 1 lambda    1.74   1.74 0.140 0.137  1.51  1.96  1.00     666.     587.
事後予測検査
複製データyrepのMCMCサンプルを取り出して、yrep1に入れておきます。
yrep1 <- fit1 |>
  as_draws_df() |>
  select(starts_with("yrep")) |>
  as_draws_matrix()
ppc_bars
複製データyrep1と観測値Yの分布を比較します。複製データの点は中央値、バーはデフォルトでは90%区間です。
ppc_bars(Y, yrep1)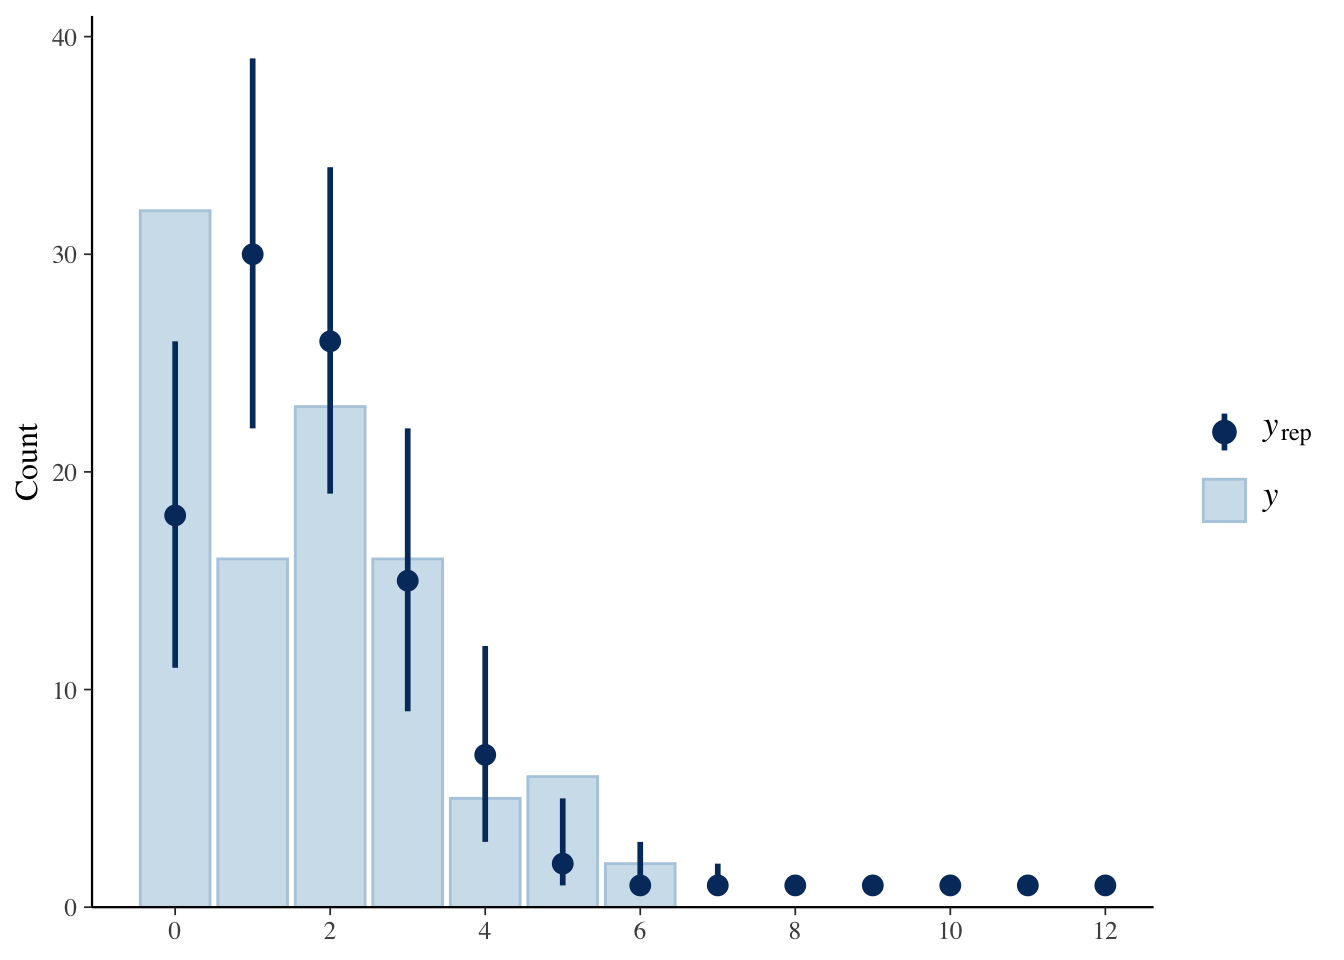
複製データは、とくに値が0と1のあたりで観測値とのあいだにズレがみられます。
ppc_rootogram
Rootgramでの比較です。表示方法には、“standing”, “hanging”, “suspended”の3種類があります。既定値の”standing”では、観測値のヒストグラムがそのまま表示され、“hanging”では、複製データの期待値からぶらさがって表示され、“suspended”では、期待値との差が表示されます。
ppc_rootogram(Y, yrep1, style = "standing")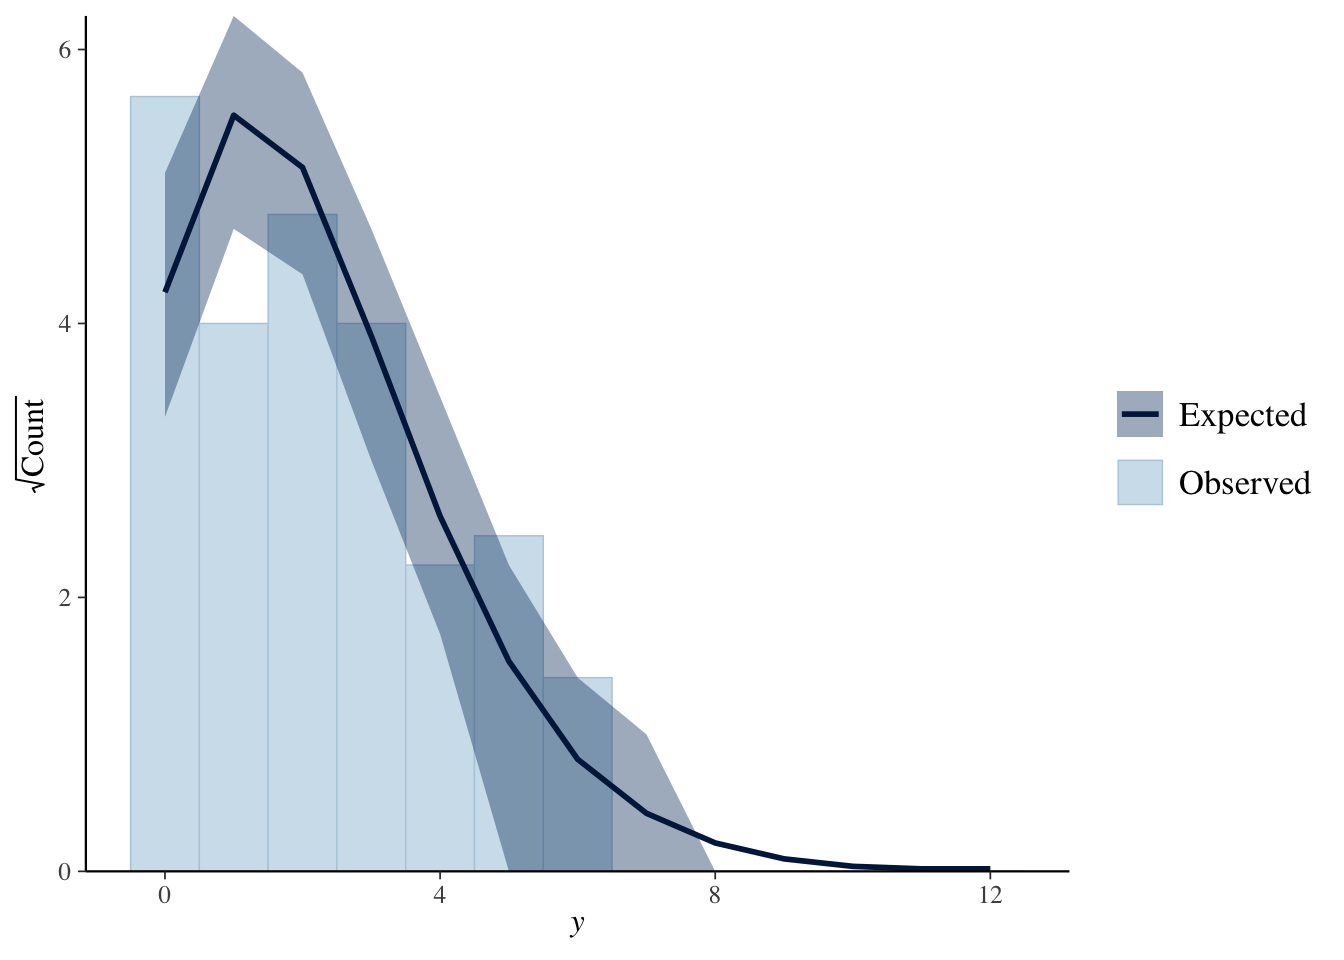
ppc_rootogram(Y, yrep1, style = "hanging")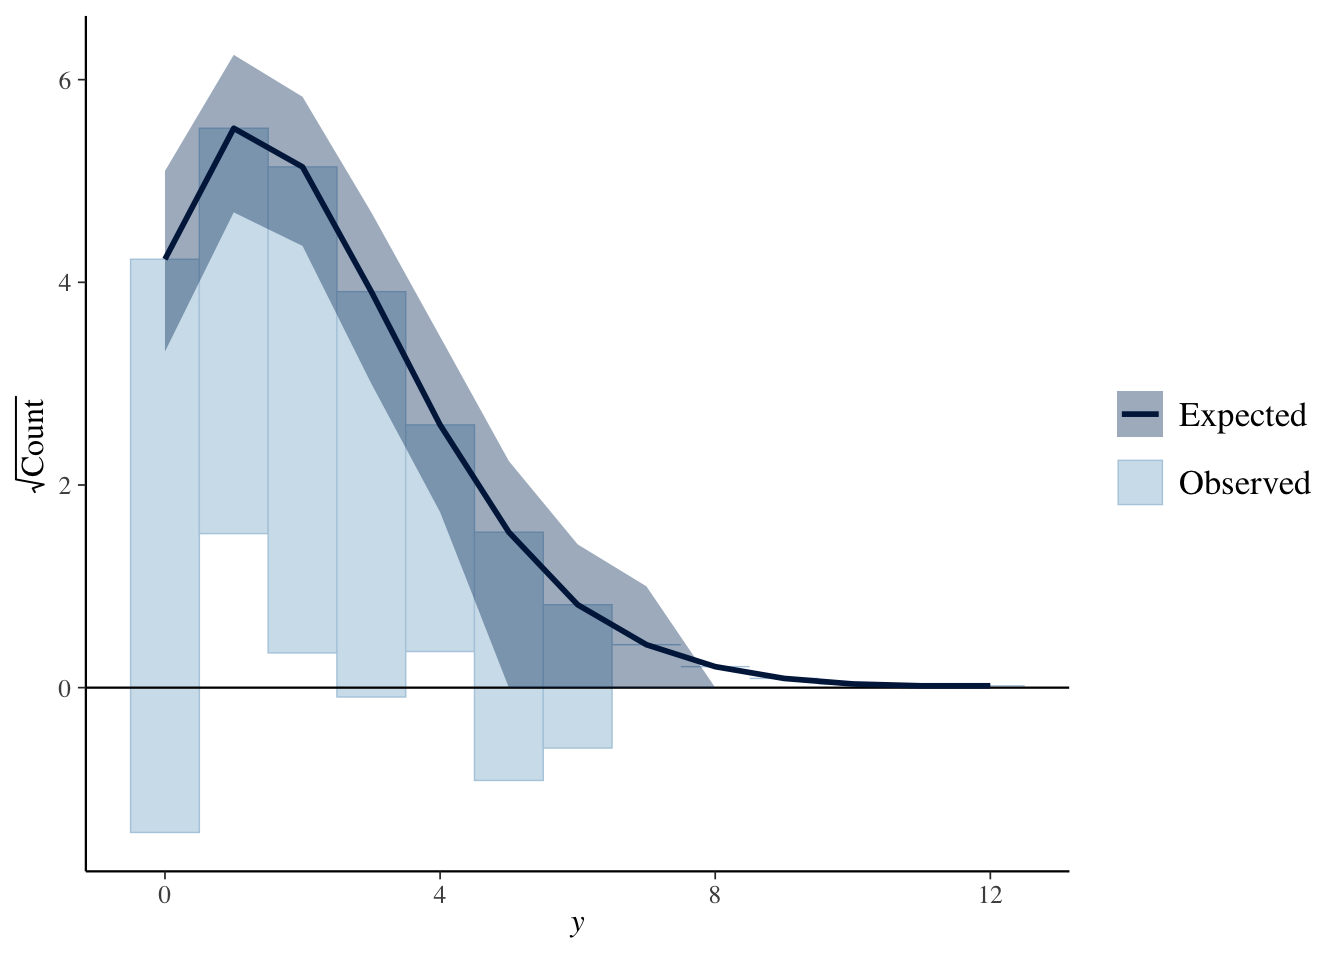
ppc_rootogram(Y, yrep1, style = "suspended")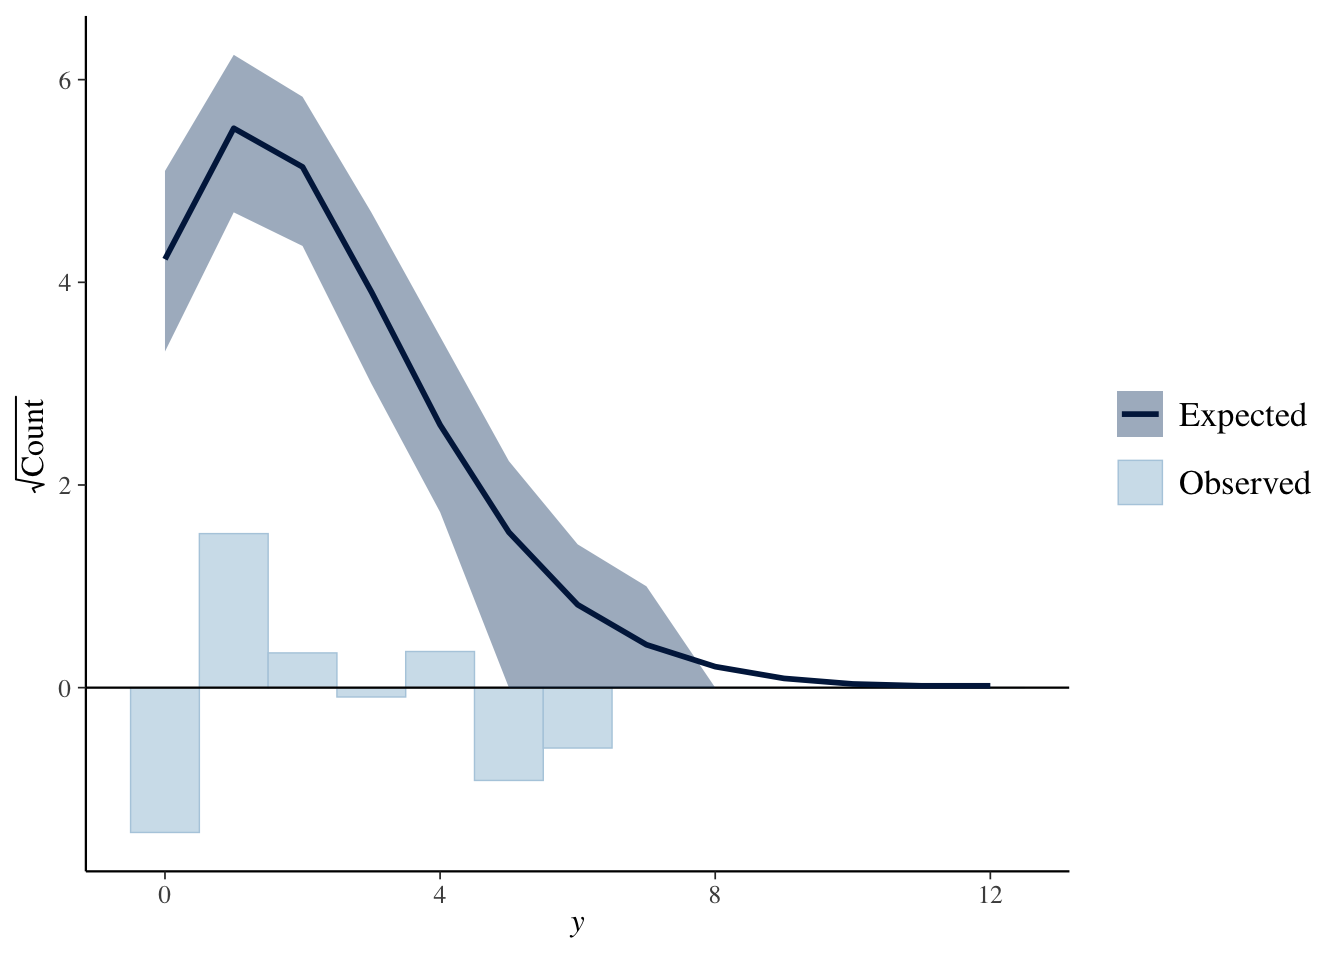
やはり、複製データは0と1のあたりでズレが大きいようです。
モデル2
つづいて、ゼロ過剰ポアソン分布のモデルをあてはめます。
code2 <- nimbleCode({
  for (n in 1:N) {
    z[n] ~ dbern(p)
    Y[n] ~ dpois(z[n] * lambda)
    # replicated data
    zrep[n] ~ dbern(p)
    yrep[n] ~ dpois(zrep[n] * lambda)
  }
  # prior
  p ~ dunif(0, 1)
  lambda ~ dunif(0, 100)
})
あてはめ
init_fun2 <- function() {
  list(p = runif(1, 0, 1),
       lambda = runif(1, 0, 2),
       z = rep(1, N),
       zrep = rep(1, N),
       yrep = rpois(N, 1))
}
fit2 <- nimbleMCMC(code = code2,
                   constants = list(N = N),
                   data = list(Y = Y),
                   inits = init_fun2,
                   monitors = c("p", "lambda", "yrep"),
                   nchains = 3,
                   niter = 2000, nburnin = 1000,
                   samplesAsCodaMCMC = TRUE)
## Defining model
## Building model
## Setting data and initial values
## Running calculate on model
##   [Note] Any error reports that follow may simply reflect missing values in model variables.
## Checking model sizes and dimensions
## Checking model calculations
## Compiling
##   [Note] This may take a minute.
##   [Note] Use 'showCompilerOutput = TRUE' to see C++ compilation details.
## running chain 1...
## |-------------|-------------|-------------|-------------|
## |-------------------------------------------------------|
## running chain 2...
## |-------------|-------------|-------------|-------------|
## |-------------------------------------------------------|
## running chain 3...
## |-------------|-------------|-------------|-------------|
## |-------------------------------------------------------|パラメータlambdaとpについて結果の要約をみます。
fit2 |>
  as_draws() |>
  summarise_draws() |>
  filter(variable %in% c("p", "lambda"))
## # A tibble: 2 × 10
##   variable  mean median     sd    mad    q5   q95  rhat ess_bulk ess_tail
##   <chr>    <num>  <num>  <num>  <num> <num> <num> <num>    <num>    <num>
## 1 lambda   2.27   2.26  0.196  0.188  1.96  2.61   1.00     457.     570.
## 2 p        0.758  0.759 0.0564 0.0569 0.667 0.854  1.01     307.     305.
事後予測検査
モデル1のときと同様に、複製データyrepのMCMCサンプルを取り出して、yrep2に入れておきます。
yrep2 <- fit2 |>
  as_draws_df() |>
  select(starts_with("yrep")) |>
  as_draws_matrix()
以下は、モデル1のときと同様です。
ppc_bars
複製データyrep2と観測値Yの分布を比較します。
ppc_bars(Y, yrep2)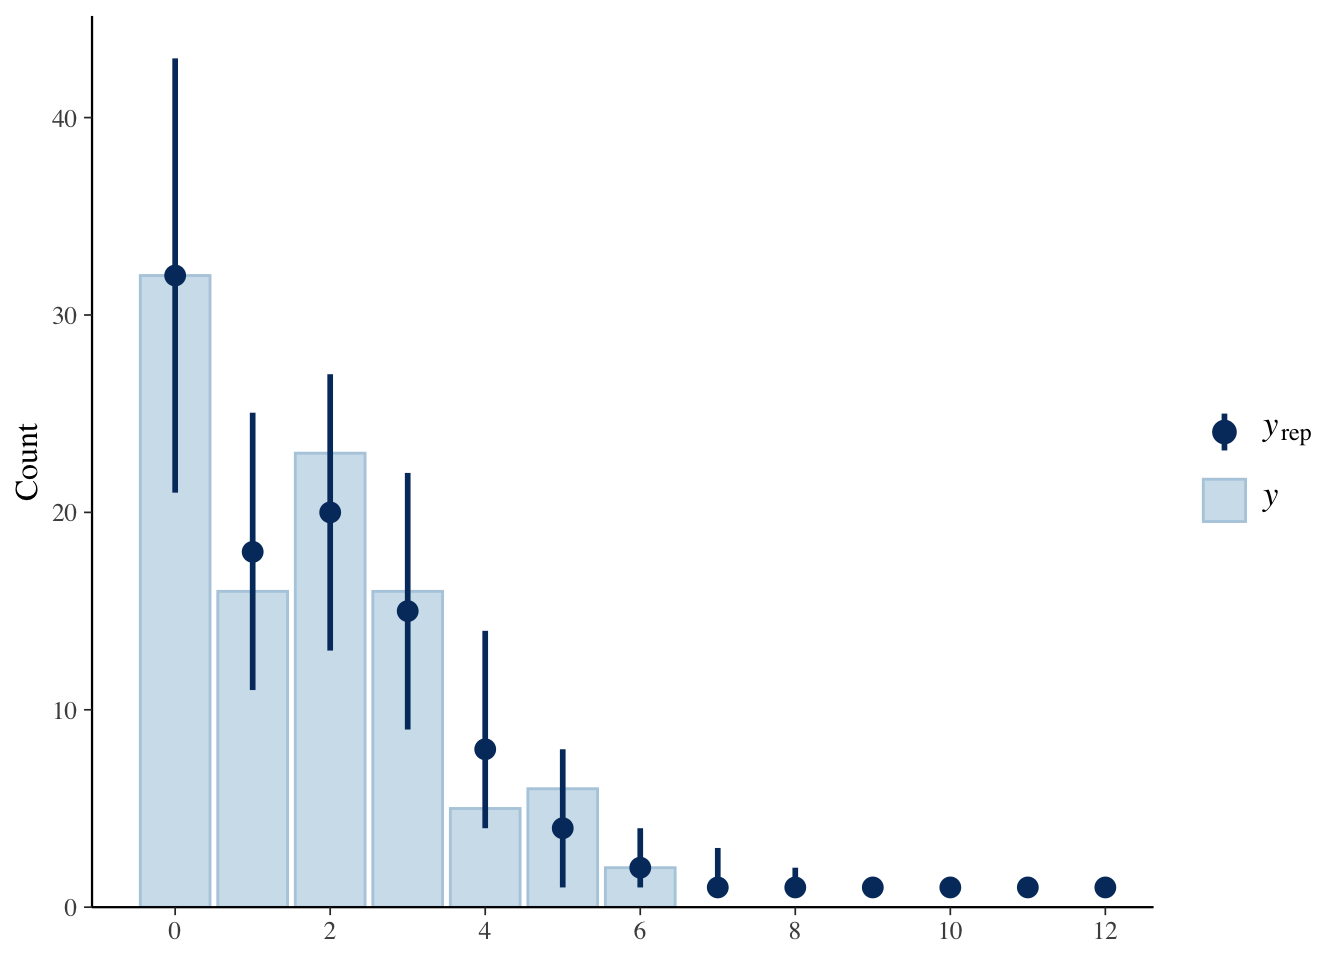
ppc_rootogram
Rootgramでの比較です。
ppc_rootogram(Y, yrep2, style = "standing")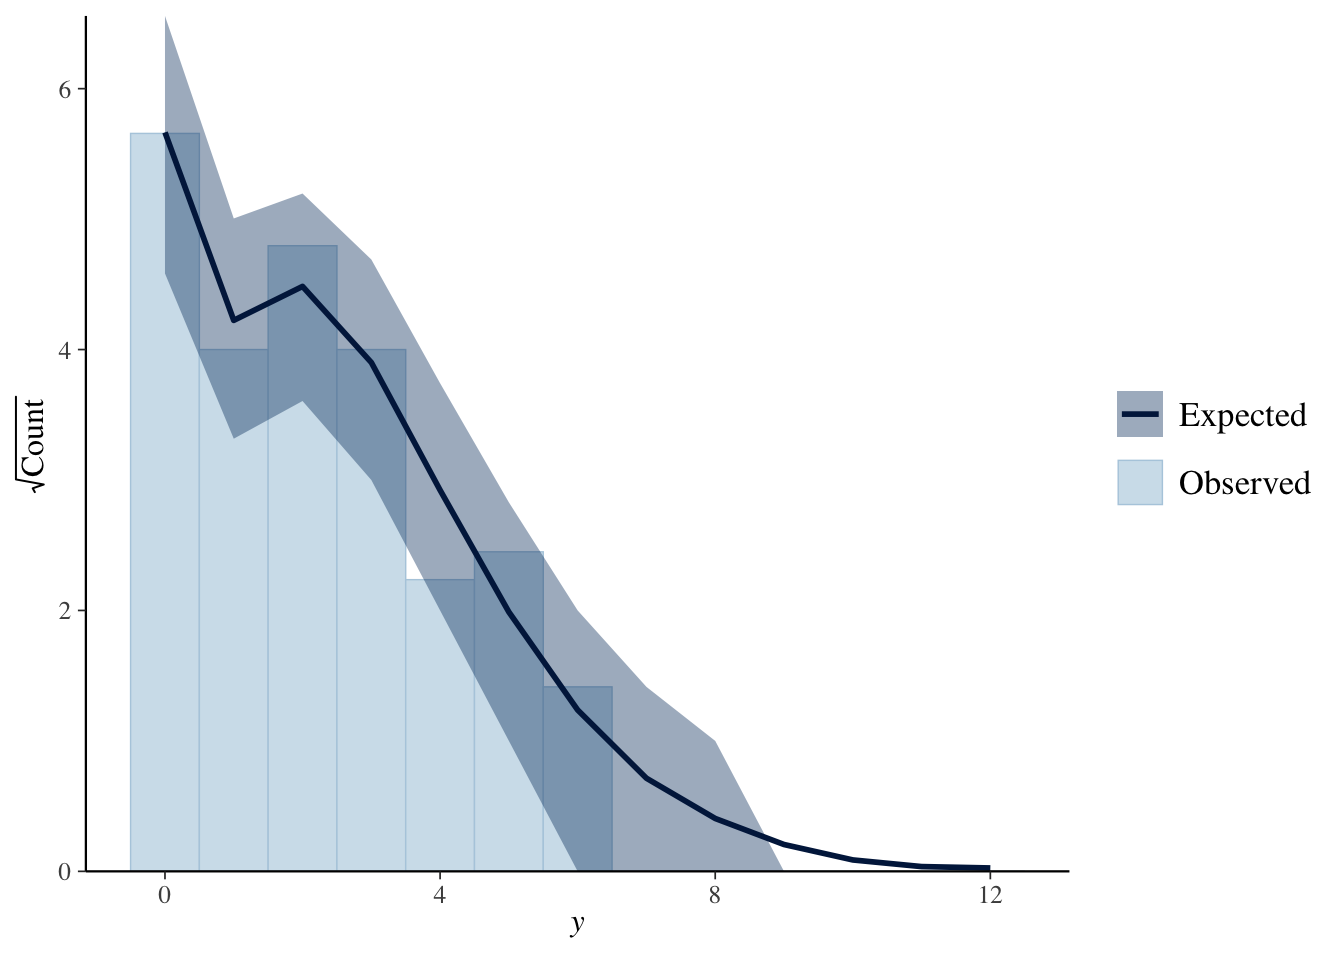
ppc_rootogram(Y, yrep2, style = "hanging")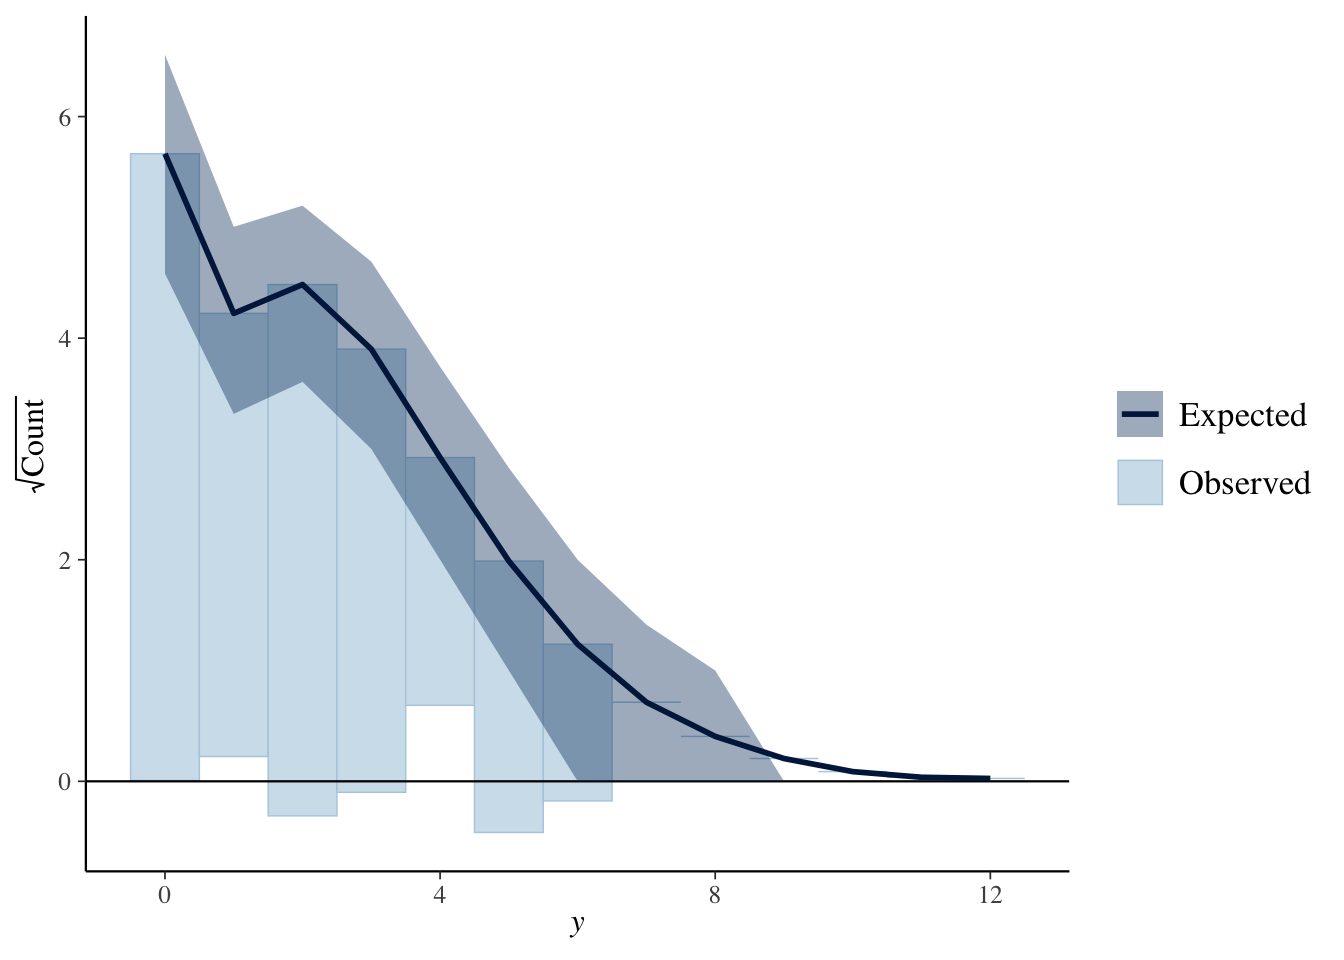
ppc_rootogram(Y, yrep2, style = "suspended")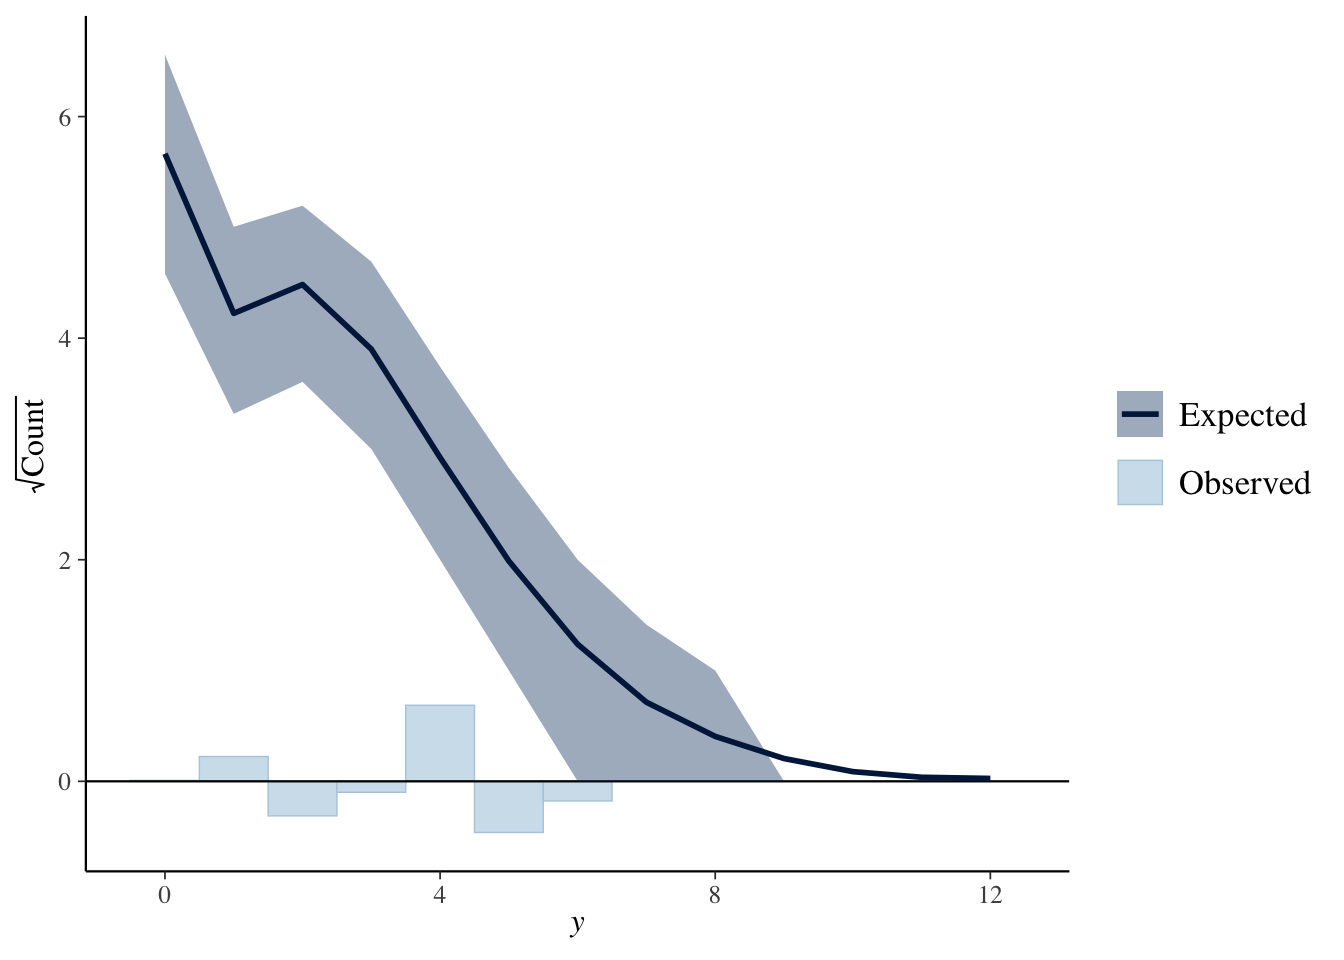
こちらは、複製データが観測値にあっているようです(そのようにつくったからですが)。
おわりに
以上のように、bayesplotパッケージの事後予測検査関数により、モデルのあてはまりを視覚的にチェックすることができます。
bayesplotパッケージ中の離散値データの事後予測検査関数の詳細については
PPCs for discrete outcomesをご覧ください。