install.packages("tidyplots")r-wakalangで紹介されていたtidyplotsをためしてみました。
準備
tidyplotsパッケージはCRANに収録されているので、普通にinstall.packages関数でインストールできます。
インストールしたら、library関数で呼び出せます。データとしてpalmerpenguinsを使用します。
library(tidyplots)
library(palmerpenguins)
プロット
散布図
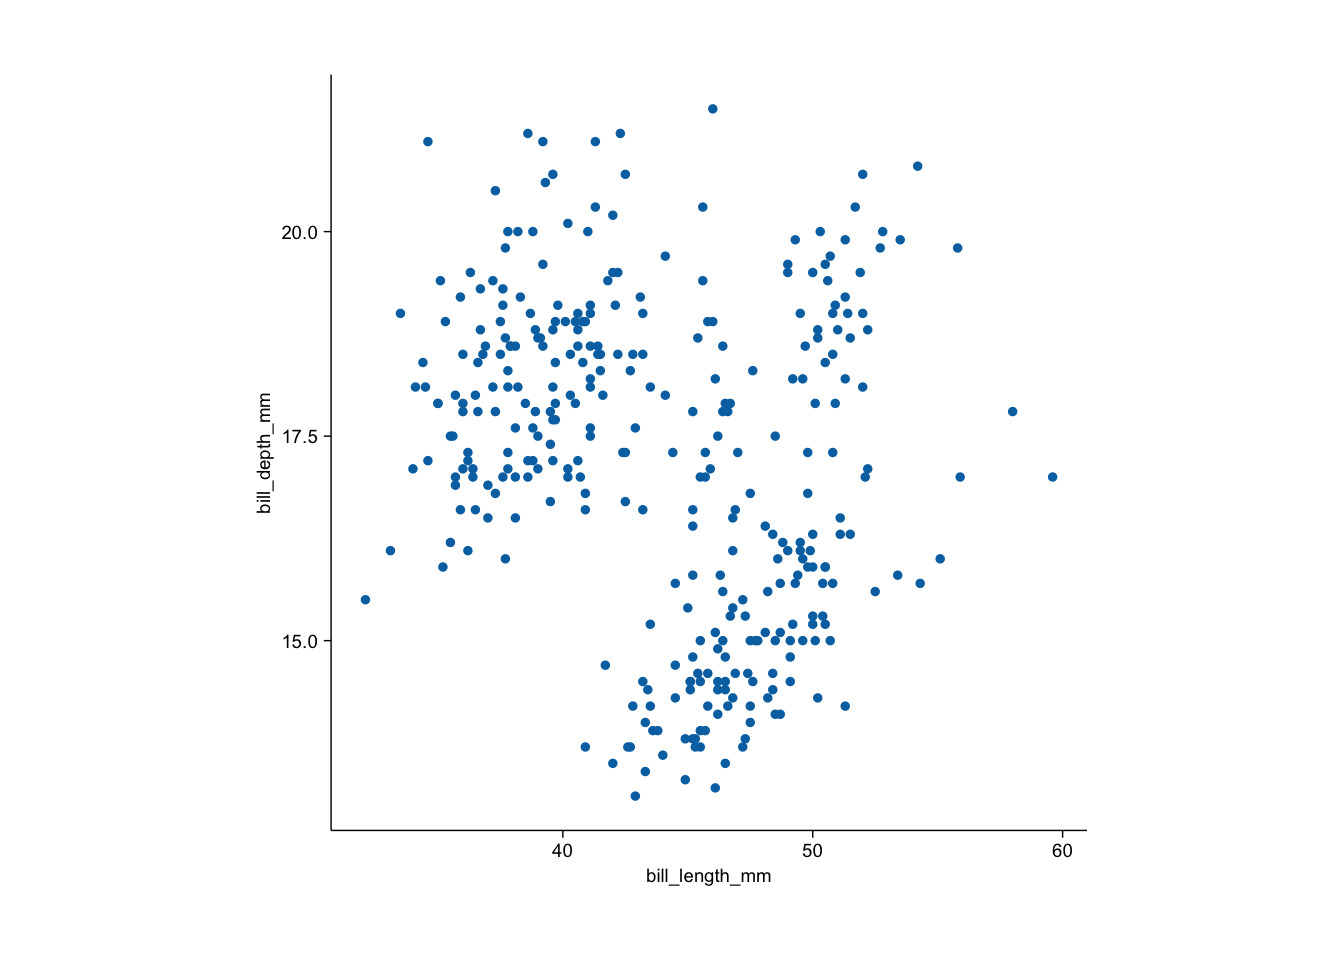
まずは散布図を描きます。パイプでオブジェクトを渡していきます。
penguins |>
  tidyplot(x = bill_length_mm, y = bill_depth_mm) |>
  add_data_points()
サイズを調整します。単位はデフォルトでmmです。
penguins |>
  tidyplot(x = bill_length_mm, y = bill_depth_mm) |>
  add_data_points() |>
  adjust_size(width = 100, height = 100)
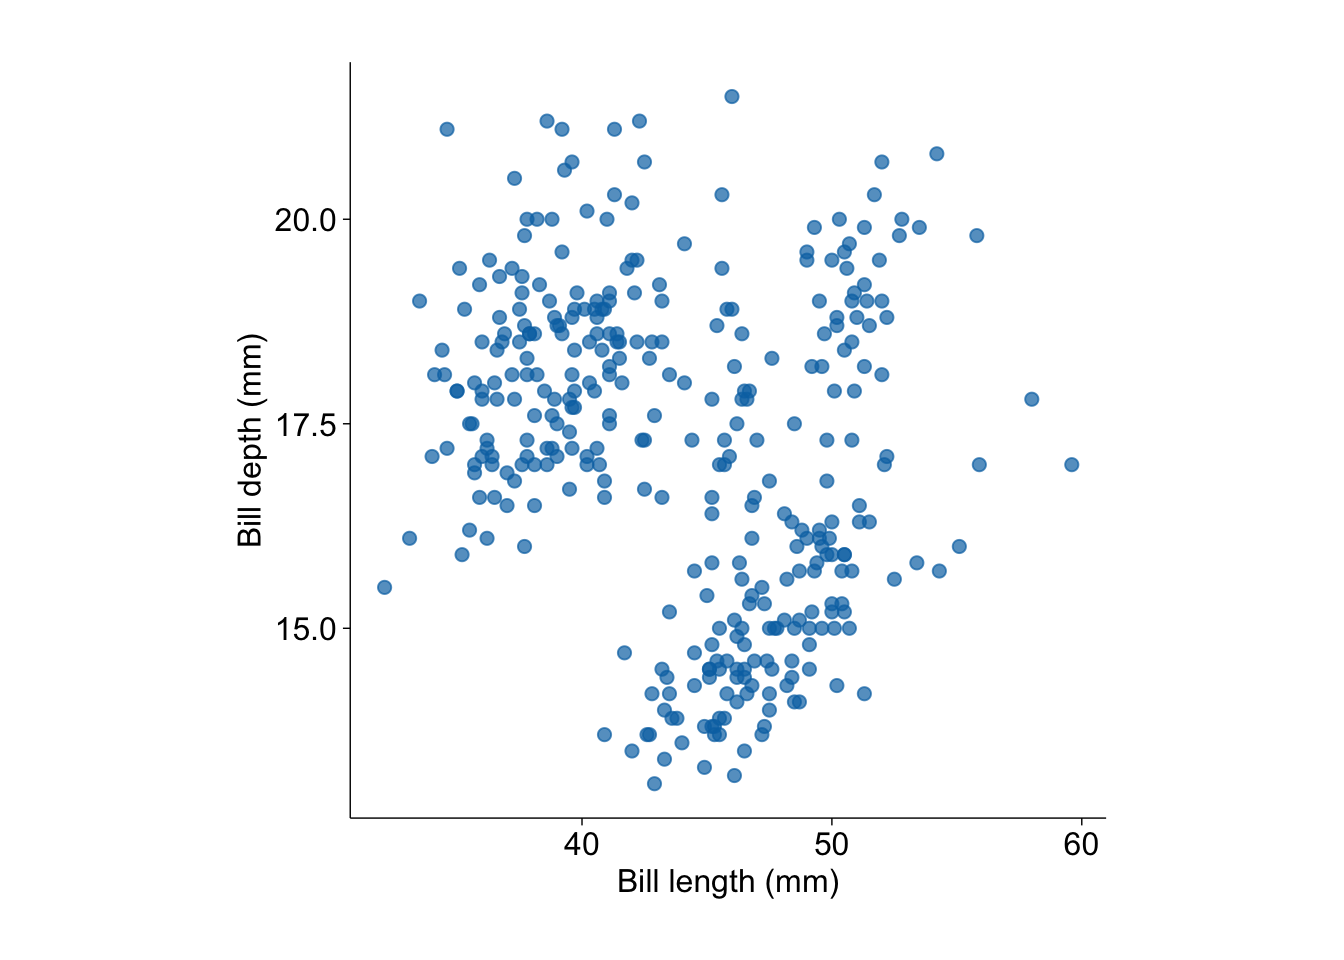
点のサイズを大きくし、半透明にします。また、軸のラベルと、全体のフォントサイズを調整しました。
penguins |>
  tidyplot(x = bill_length_mm, y = bill_depth_mm) |>
  add_data_points(size = 2, alpha = 0.7) |>
  adjust_x_axis_title("Bill length (mm)") |>
  adjust_y_axis_title("Bill depth (mm)") |>
  adjust_size(width = 100, height = 100) |>
  theme_tidyplot(fontsize = 12)
種ごとに色を変えます。
penguins |>
  tidyplot(x = bill_length_mm, y = bill_depth_mm, color = species) |>
  add_data_points(size = 2, alpha = 0.7) |>
  adjust_x_axis_title("Bill length (mm)") |>
  adjust_y_axis_title("Bill depth (mm)") |>
  adjust_size(width = 100, height = 100) |>
  theme_tidyplot(fontsize = 12)
棒グラフ
種ごとにクチバシの長さを比較します。
棒グラフの前にまずは散布図を描きます。X方向にジッターを追加しています。
penguins |>
  tidyplot(x = species, y = bill_length_mm) |>
  add_data_points_jitter(size = 2, alpha = 0.7, jitter_height = 0) |>
  adjust_x_axis_title("Species") |>
  adjust_y_axis_title("Bill length (mm)") |>
  adjust_size(width = 100, height = 100) |>
  theme_tidyplot(fontsize = 12)
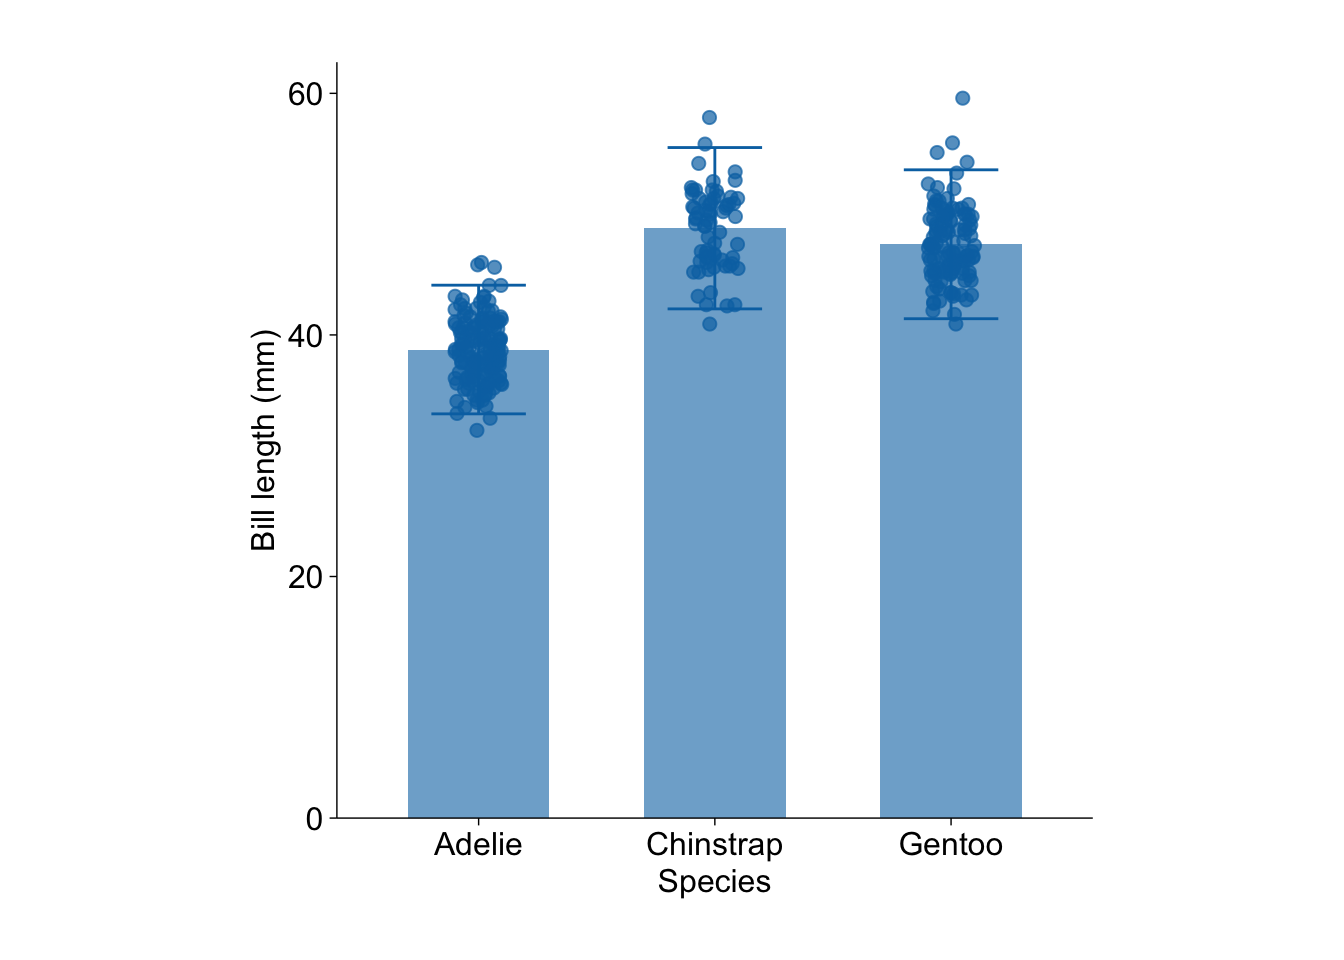
各種の平均を棒グラフにして追加します。
penguins |>
  tidyplot(x = species, y = bill_length_mm) |>
  add_data_points_jitter(size = 2, alpha = 0.7, jitter_height = 0) |>
  add_mean_bar(alpha = 0.6) |>
  adjust_x_axis_title("Species") |>
  adjust_y_axis_title("Bill length (mm)") |>
  adjust_size(width = 100, height = 100) |>
  theme_tidyplot(fontsize = 12)
標準偏差の誤差線を追加しました。
penguins |>
  tidyplot(x = species, y = bill_length_mm) |>
  add_data_points_jitter(size = 2, alpha = 0.7, jitter_height = 0) |>
  add_mean_bar(alpha = 0.6) |>
  add_sd_errorbar(linewidth = 0.5) |>
  adjust_x_axis_title("Species") |>
  adjust_y_axis_title("Bill length (mm)") |>
  adjust_size(width = 100, height = 100) |>
  theme_tidyplot(fontsize = 12)
箱ヒゲ図
平均の棒グラフのかわりに箱ヒゲ図を重ねます。箱ヒゲ図の外れ値の点はalpha=0にして、表示しないようにしています。
penguins |>
  tidyplot(x = species, y = bill_length_mm) |>
  add_data_points_jitter(size = 2, alpha = 0.7, jitter_height = 0) |>
  add_boxplot(outlier.alpha = 0) |>
  adjust_x_axis_title("Species") |>
  adjust_y_axis_title("Bill length (mm)") |>
  adjust_size(width = 100, height = 100) |>
  theme_tidyplot(fontsize = 12)
雌雄で分けて表示しました。
penguins |>
  tidyplot(x = species, y = bill_length_mm, color = sex) |>
  add_data_points_jitter(size = 2, alpha = 0.7, jitter_height = 0) |>
  add_boxplot(outlier.alpha = 0) |>
  adjust_x_axis_title("Species") |>
  adjust_y_axis_title("Bill length (mm)") |>
  adjust_size(width = 100, height = 100) |>
  theme_tidyplot(fontsize = 12)
横軸を雌雄にして、種ごとに分割して、ジッターつき散布図を描画するようにしました。remove_legend()で凡例を消してあります。
penguins |>
  tidyplot(x = sex, y = bill_length_mm, color = sex) |>
  add_data_points_jitter(size = 2, alpha = 0.7, jitter_height = 0) |>
  adjust_x_axis_title("Species") |>
  adjust_y_axis_title("Bill length (mm)") |>
  theme_tidyplot(fontsize = 9) |>
  remove_legend() |>
  split_plot(by = species, width = 40, heights = 40)
なお、split_plot関数の返り値のクラスは
[1] "patchwork" "plot_filler" "gg" "ggplot"
で、tidyplotクラスではなくなっています。なので、tidyplotオブジェクトを第1引数とする関数に、この返り値をさらにわたすことはできません。
ざっとつかってみた感想
add_*で要素を足して、remove_*で消し、adjust_*で調整するというのはわりと直感的につかえるのではと思いました。
また、平均の棒グラフ+誤差線のグラフとか、あるいは2個の棒グラフを比較して有意差の*をつけた(add_test_asterisks)グラフとかは、生物学の論文でよく目にするタイプのグラフですが、こういうものが簡単に描けるようになっているようです。