library(purrr)
library(furrr)
## 要求されたパッケージ future をロード中です
library(ggplot2)
library(nimble)
## nimble version 1.2.1 is loaded.
## For more information on NIMBLE and a User Manual,
## please visit https://R-nimble.org.
##
## Note for advanced users who have written their own MCMC samplers:
##   As of version 0.13.0, NIMBLE's protocol for handling posterior
##   predictive nodes has changed in a way that could affect user-defined
##   samplers in some situations. Please see Section 15.5.1 of the User Manual.
##
## 次のパッケージを付け加えます: 'nimble'
## 以下のオブジェクトは 'package:stats' からマスクされています:
##
##     simulate
## 以下のオブジェクトは 'package:base' からマスクされています:
##
##     declare
library(stringr)NIMBLE のMCMC計算に時間がかかるとき、連鎖ごとに並列実行したいと思うことがありました。これについて NIMBLE User Manual には Running MCMC chains in parallel という節がありまして、以下のように書いてあります。
It is possible to run multiple chains in parallel using standard R parallelization packages such as
parallel,foreach, andfuture.
そして、実例は Parallelization with NIMBLE を見よ、となっていて、リンク先ではparallelパッケージのparLapply関数を使用した例が紹介されています。
これをそのままやってみても芸がなので、 furrr パッケージを使って並列化してみました。purrrの並列化版のようです。今回参考にしたのは、Atusyさんの「furrr パッケージで R で簡単並列処理」です。
準備
furrrパッケージはCRANにあるので、こちらからインストールしました。その他パッケージを読み込みます。
データ
データとモデルは、「NIMBLEによる季節調整モデル」のものを使用します。まずはデータを読み込みます。
data_url <- "https://raw.githubusercontent.com/iwanami-datascience/vol1/master/matsuura/example2/input/data-season.txt"
data <- readr::read_csv(data_url)
## Rows: 44 Columns: 1
## ── Column specification ────────────────────────────────────────────────────────
## Delimiter: ","
## dbl (1): Y
##
## ℹ Use `spec()` to retrieve the full column specification for this data.
## ℹ Specify the column types or set `show_col_types = FALSE` to quiet this message.
data$Time <- seq_along(data$Y)
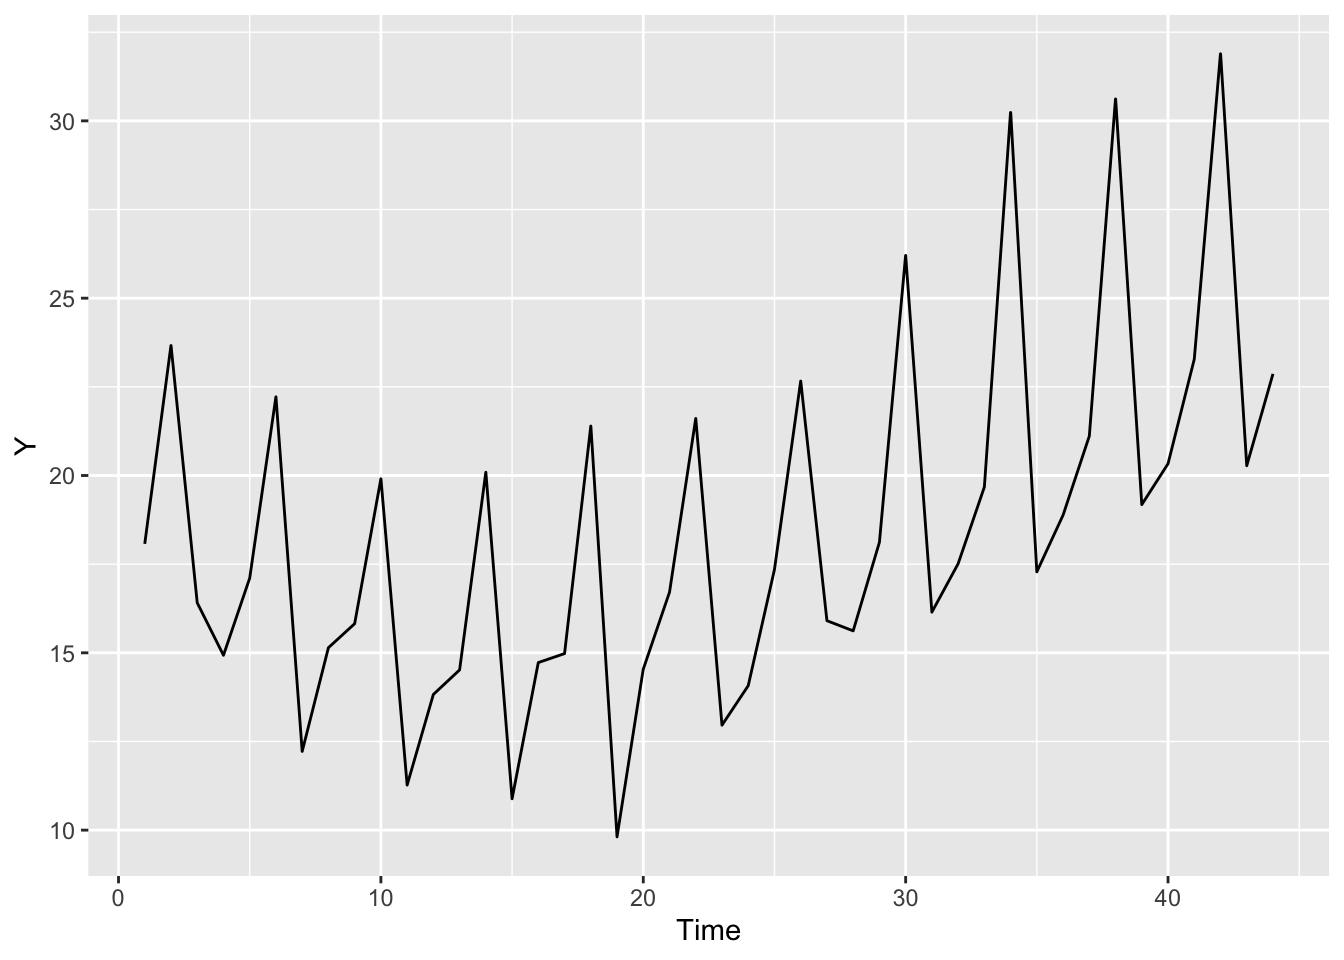
データをプロットします。こういう時系列データです。
p <- ggplot(data) +
  geom_line(aes(x = Time, y = Y))
plot(p)
モデル
NIMBLEのモデルです。季節調整つきの状態空間モデルです。
code <- nimbleCode({
  # observation
  for (t in 1:T) {
    Y[t] ~ dnorm(mu[t] + season[t], tau[1])
  }

  # level
  for (t in 3:T) {
    mu[t] ~ dnorm(2 * mu[t - 1] - mu[t - 2], tau[2])
  }

  # seasonal
  for (t in 4:T) {
    season[t] ~ dnorm(-sum(season[(t - 3):(t - 1)]), tau[3])
  }

  # forecast
  for (t in (T + 1):(T + T_new)) {
    Y_new[t - T] ~ dnorm(mu[t] + season[t], tau[1])
    mu[t] ~ dnorm(2 * mu[t - 1] - mu[t - 2], tau[2])
    season[t] ~ dnorm(-sum(season[(t - 3):(t - 1)]), tau[3])
  }

  # priors
  for (t in 1:2) {
    mu[t] ~ dnorm(0, 1e-4)
  }
  for (t in 1:3) {
    season[t] ~ dnorm(0, 1e-4)
  }
  for (i in 1:3) {
    tau[i] <- 1 / (sigma[i] * sigma[i])
    sigma[i] ~ dunif(0, 100)
  }
})
実行関数
NIMBLEでMCMCを実行する関数を定義します。このあたりは、Parallelization with NIMBLE を参考にしています。Running MCMC chains in parallelに以下のようにあるとおり、モデルのオブジェクトはそれぞれの連鎖ごとに生成します。
However, you must create separate copies of all model and MCMC objects using
nimbleModel,buildMCMC,compileNimble, etc. This is because NIMBLE uses Reference Classes and R6 classes, so copying such objects simply creates a new variable name that refers to the original object.
mcmc_func <- function(data, code, T_new = 8, seed = 1,
                      niter = 2000, nburnin = 1000, thin = 1) {

  T_num <- nrow(data)
  init_func <- function() {
    list(mu = rnorm(T_num + T_new, 20, 2),
         season = rnorm(T_num + T_new, 0, 2),
         Y_new = rnorm(T_new, 20, 2),
         sigma= runif(3, 0, 2))
  }

  model <- nimbleModel(code = code,
                       constants = list(T = T_num, T_new = T_new),
                       data = list(Y = data$Y))
  cmodel <- compileNimble(model)
  rmcmc <- buildMCMC(model, print = FALSE)
  cmcmc <- compileNimble(rmcmc, project = model)
  fit <- runMCMC(cmcmc, nchains = 1, niter = niter, nburnin = nburnin,
                 thin = thin,
                 inits = init_func, setSeed = seed,
                 progressBar = FALSE,
                 samplesAsCodaMCMC = TRUE)
  return(fit)
}
purrr版
まずはpurrrパッケージのmap関数で実行してみます。
nchains <- 4

set.seed(123)
system.time(
  purrr_fit <- purrr::map(1:nchains,
                          ~ mcmc_func(data = data, code = code,
                                      T_new = 8, seed = .x,
                                      niter = 55000, nburnin = 5000, thin = 10))
)
##   ユーザ システム     経過
##   51.012    3.200   61.276
手もとの環境(MacBook Pro 16インチ 2021, Apple M1 Max)ではおよそ60秒かかりました。
モデル中の標準偏差のパラメータsigmaの事後分布の要約です。
purrr_draws <- purrr_fit |>
  coda::as.mcmc.list() |>
  posterior::as_draws()
purrr_draws |>
  summary() |>
  dplyr::filter(str_starts(variable, "sigma"))
## # A tibble: 3 × 10
##   variable  mean median     sd    mad     q5   q95  rhat ess_bulk ess_tail
##   <chr>    <dbl>  <dbl>  <dbl>  <dbl>  <dbl> <dbl> <dbl>    <dbl>    <dbl>
## 1 sigma[1] 0.281  0.253 0.183  0.191  0.0429 0.625  1.01     265.     343.
## 2 sigma[2] 0.109  0.102 0.0364 0.0304 0.0640 0.178  1.00    2381.    4690.
## 3 sigma[3] 0.717  0.715 0.130  0.123  0.509  0.935  1.00    1141.    1696.
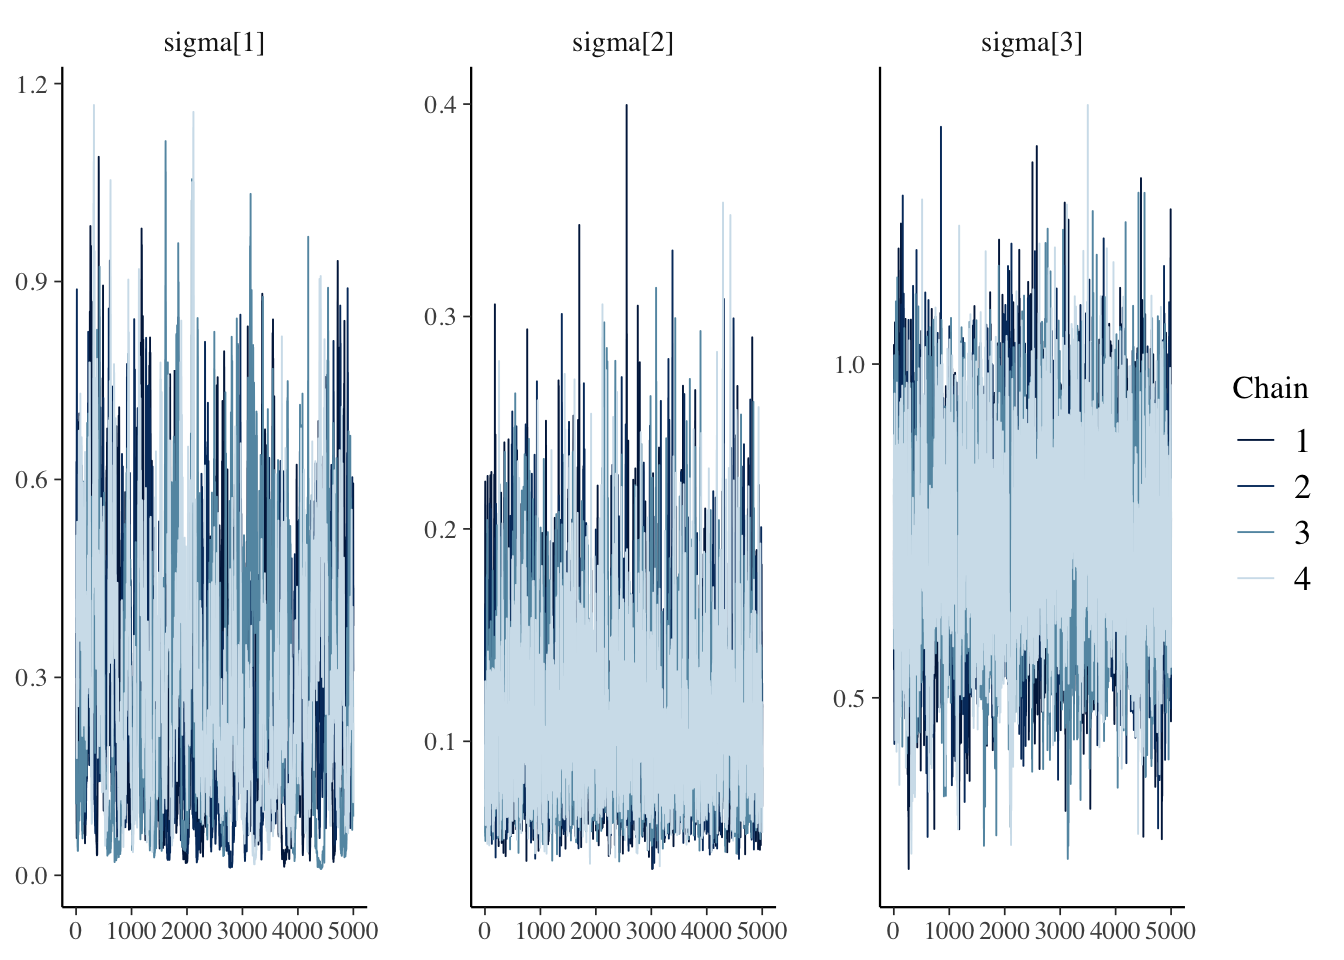
同、MCMCの軌跡です。
purrr_draws |>
  bayesplot::mcmc_trace(pars = str_c("sigma[", 1:3, "]"))
furrr版
つづいてfurrrで平滑化したバージョンです。
コア4つを使用したマルチセッションで実行するようにします。
plan(multisession, workers = 4)擬似乱数を固定するため、.options = furrr_options(seed = 1L)という引数をつけます。
set.seed(123)
system.time(
  furrr_fit <- future_map(1:nchains,
                          ~ mcmc_func(data = data, code = code,
                                      T_new = 8, seed = .x,
                                      niter = 55000, nburnin = 5000, thin = 10),
                         .options = furrr_options(seed = 1L))
)
##   ユーザ システム     経過
##    0.515    0.078   20.061
計算時間はおよそ20秒になりました。並列化の効果が出たようです。
sigmaの事後分布の要約です。乱数が変わるので、purrrの計算結果とは完全には一致しません。
furrr_draws <- furrr_fit |>
  coda::as.mcmc.list() |>
  posterior::as_draws()
furrr_draws |>
  summary() |>
  dplyr::filter(str_starts(variable, "sigma"))
## # A tibble: 3 × 10
##   variable  mean median     sd    mad     q5   q95  rhat ess_bulk ess_tail
##   <chr>    <dbl>  <dbl>  <dbl>  <dbl>  <dbl> <dbl> <dbl>    <dbl>    <dbl>
## 1 sigma[1] 0.288  0.260 0.191  0.193  0.0262 0.647  1.04     122.     154.
## 2 sigma[2] 0.108  0.101 0.0359 0.0298 0.0637 0.174  1.00    2340.    3999.
## 3 sigma[3] 0.713  0.711 0.133  0.125  0.499  0.935  1.01     899.    1110.
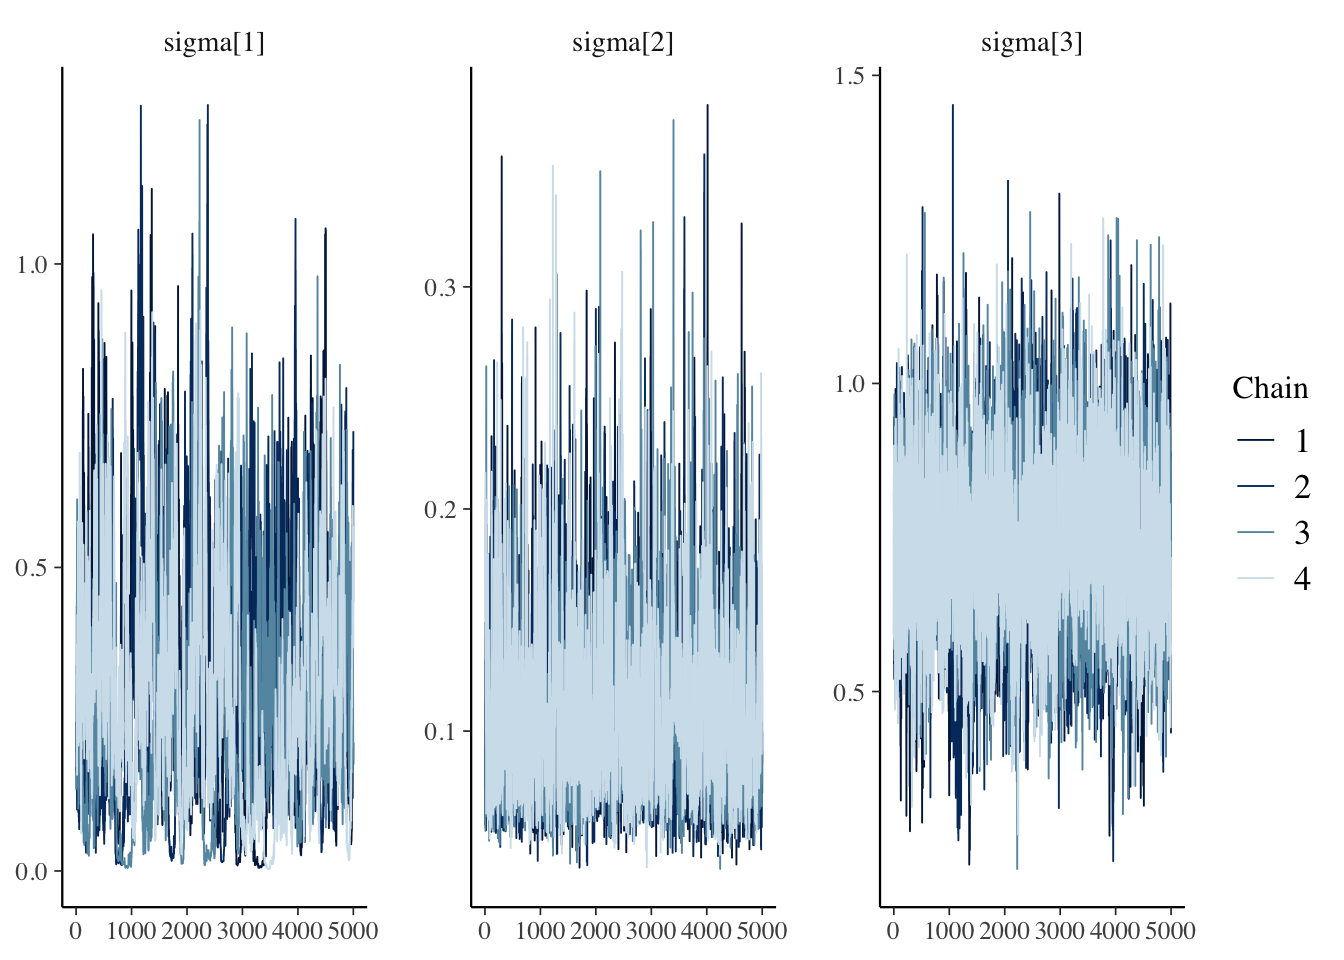
同じく、軌跡です。
furrr_draws |>
  bayesplot::mcmc_trace(pars = str_c("sigma[", 1:3, "]"))