#
# This is the global settings of a Shiny web application.
#

library(tidyverse)

# Load the bear data from a parquet file
kuma_data <- file.path("data", "kuma_data.parquet") |>
  nanoparquet::read_parquet() |>
  # Select relevant columns and rename them for clarity
  dplyr::mutate(
    year = `出没年`,
    longitude = `経度`,
    latitude = `緯度`,
    type = case_match(
      `目撃痕跡種別`,
      "目撃" ~ "目撃",
      "痕跡" ~ "痕跡",
      .default = "人身被害・その他"),
    comment = stringr::str_c(
      year(`出没日`), "年", month(`出没日`), "月", day(`出没日`), "日 ",
      htmltools::htmlEscape(`時刻`),
      "<br />",
      if_else(`森林からの出没`, "【森林からの出没】", ""),
      if_else(`河川からの出没`, "【河川からの出没】", ""),
      if_else(`誘引物が原因の出没`, "【誘引物が原因の出没】", ""),
      if_else(`繁殖・分散行動による出没`, "【繁殖・分散行動による出没】", ""),
      if_else(`大量出没年に特有の出没`, "【大量出没年に特有の出没】", ""),
      "<br />",
      htmltools::htmlEscape(`備考`)
    ),
    .keep = "none"
  )

# palette colors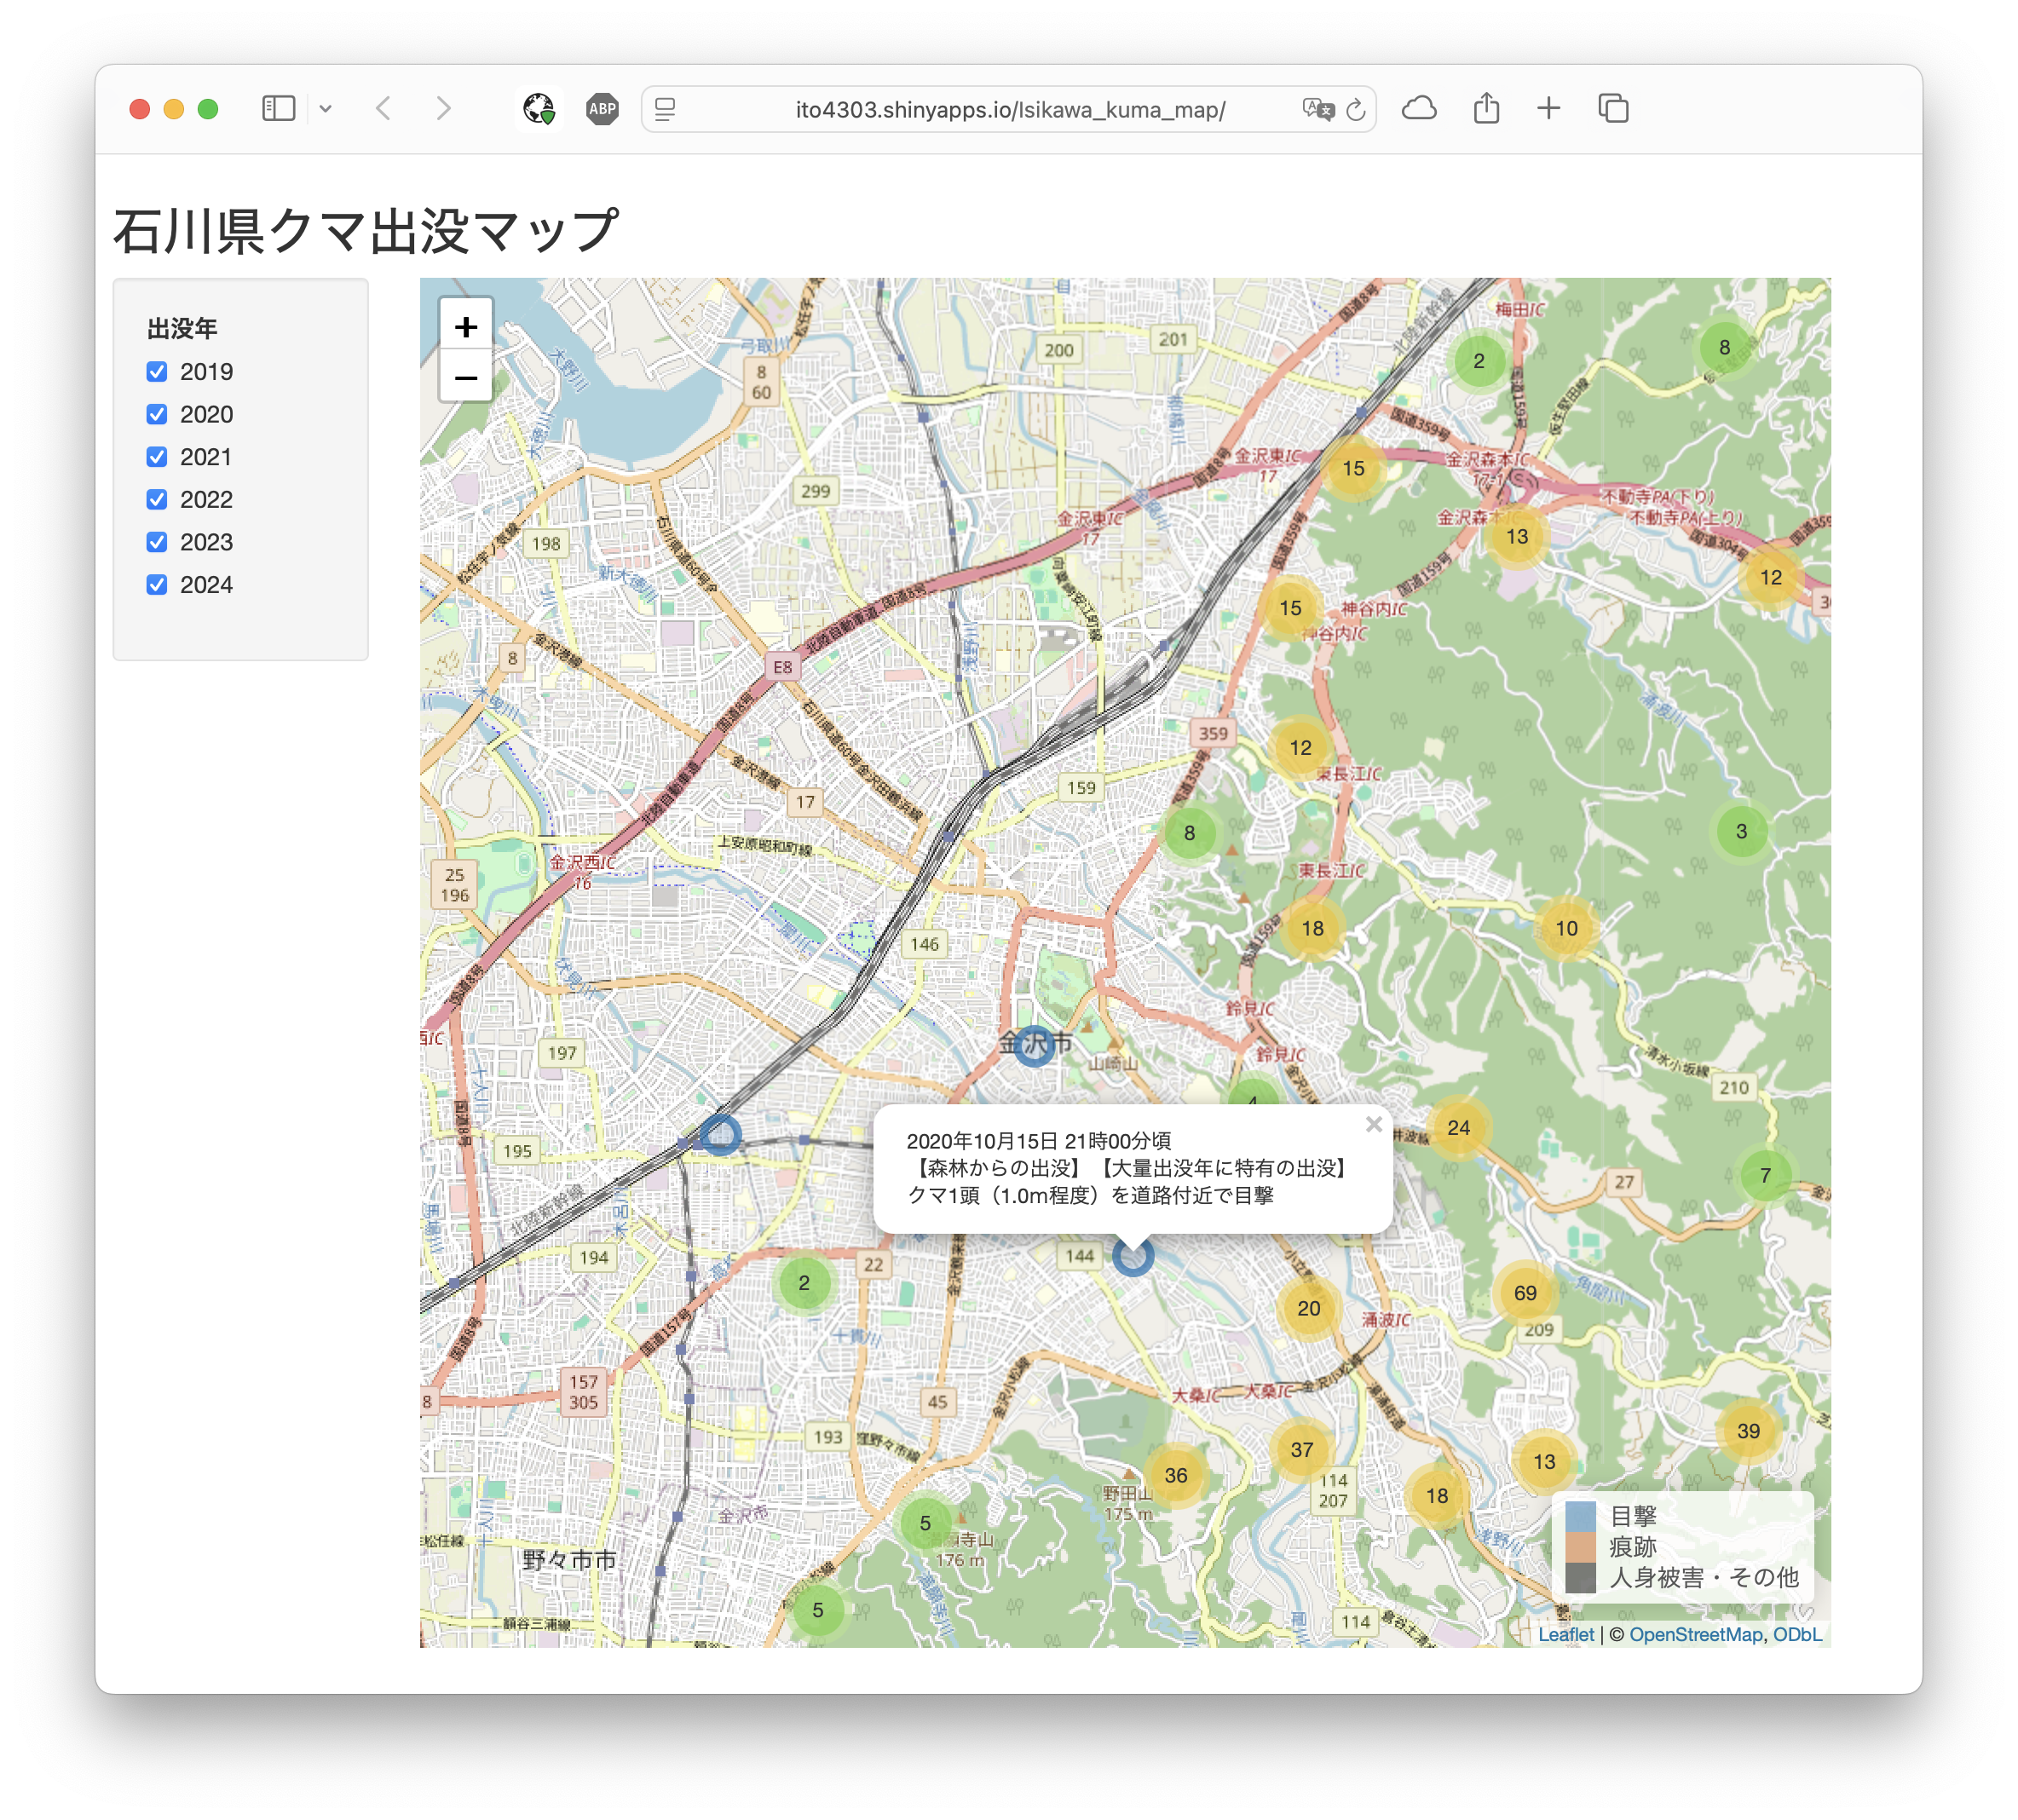
pal_colors <- palette.colors(n = 8, palette = "Okabe-Ito")「クマ共生ハッカソン」の一環で、2019〜2024年の石川県のクマ出没情報を地図上に表示したクマ出没マップを作成しました。前回の予測マップとは異なり、過去の情報をまとめたものです。
Rコード
RとShinyを使用して、Leafletの地図を表示するウェブアプリとして作成しました。
Rのファイルは以下の3つです。
- global.R: データ処理
- ui.R: ユーザーインターフェイスの定義
- server.R: 動作の定義
以下、簡単に説明します。
global.R
8行目で、前処理で作成しておいたParquetファイルを指定し、9行目で読み込んでいます。
11行目から、マップで使うデータを用意していきます。
year、longitude、latitudeは、それぞれ出没年、経度、緯度をコピーします。typeは、目撃痕跡種別です。「目撃」「痕跡」「人身被害」のほかに1個だけ「1」という値があって、おそらく入力ミスと思われますが、「人身被害」とともに、「人身被害・その他」とするようにしました。commentは、マーカーをクリックしたときにポップアップで表示される内容です。日付・時刻を1行目に、出没タイプを2行目に、備考の内容を3行目に表示するようにしています。32行目の’
.keep = "none"’で、以上の変数だけを残すようにしています。
36行目で、色のパレットを定義しています。
ui.R
16行目でタイトルを設定しています。
18行目からサイドバーのレイアウトを定義しています。
checkboxGroupInputで、出没年をチェックボタンで選べるようにしています。
32行目からはメインパネルの定義です。
leafletOutputで、leafletの地図を表示するようにしています。40行目のCSSで、地図を縦に広げています。
#
# This is the user-interface definition of a Shiny web application. You can
# run the application by clicking 'Run App' above.
#
# Find out more about building applications with Shiny here:
#
#    https://shiny.posit.co/
#

library(shiny)
library(leaflet)

fillPage(

  # App title
  titlePanel("石川県クマ出没マップ"),

  sidebarLayout(
    sidebarPanel(
      # checkbox group for filtering by year
      checkboxGroupInput(
        inputId = "checkbox_group",
        label = "出没年",
        choices = as.character(2019:2024),
        selected = as.character(2019:2024),
        width = "95%"
      ),
      width = 2
    ),

    # Show the map
    mainPanel(
      # c.f. https://blog.atusy.net/2019/08/01/shiny-plot-height/
      div (
        leafletOutput(
          outputId = "map",
          width = "95%",
          height = "100%"
        ),
        style = "height: calc(100vh  - 100px)"
      ),
      width = 10
    )
  ),
  padding = 10
)
server.R
14行目の
renderLeafletで、leafletの地図を描画します。15行目のデータをパイプ演算子で16行目の
leaflet関数に渡し、17行目でタイル(デフォルトのOpenStreetMap)を追加し、18行目で位置を設定しています。19行目からは凡例を表示しています。
27行目からは、マーカーの表示です。チェックボタンに変化があったときに再描画するように
observeEventの中に入っています。42行目の”
clusterOptions = TRUE“で、マーカーが集中しているところがクラスターで表示されるようになります。これにあわせて、33行目の”clearMarkerClusters()“で、チェックボタンに変化があったときはクラスターもいったん消すようにしています。45行目の”
ignoreNULL = FALSE“がないと、チェックボタンを全部外したときに更新がされなくなってしまいますので、これを防ぐために入れておきます。
#
# This is the server logic of a Shiny web application. You can run the
# application by clicking 'Run App' above.
#
# Find out more about building applications with Shiny here:
#
#    https://shiny.posit.co/
#

library(shiny)
library(leaflet)

function(input, output, session) {
  output$map <- renderLeaflet({
    kuma_data |>
    leaflet() |>
      addTiles() |>
      setView(136.6, 36.8, zoom = 9) |>
    addLegend(
      position = "bottomright",
      colors = pal_colors[c(6, 7, 1)],
      labels = c("目撃", "痕跡", "人身被害・その他"))
  })

  # checkboxGroupInput is used to filter the data
  # and update the map based on selected years
  observeEvent(input$checkbox_group, {
    leafletProxy(
      mapId = "map",
      data = kuma_data |>
        dplyr::filter(as.character(year) %in% input$checkbox_group)
    ) |>
      clearMarkerClusters() |>
      clearMarkers() |>
      addCircleMarkers(
        color = ~case_when(
          type == "目撃" ~ pal_colors[6],
          type == "痕跡" ~ pal_colors[7],
          .default = pal_colors[1]),
        opacity = 0.7,
        popup = ~comment,
        clusterOptions = TRUE
      )
  },
  ignoreNULL = FALSE)
}
アプリの作成
あとは、RStudioの”Run”ボタンを押すと、ウェブアプリが起動します。
今回はさらに、“Publish”ボタンから、アプリをshinyapps.ioにアップロードしました。
石川県クマ出没マップとして、公開しています。
おわりに
Shinyを使うことで、比較的簡単にウェブアプリを公開できました。予測マップもウェブアプリにするのがよいかもしれません。