library(ggplot2)複数の母数の組み合わせについて関数の曲線をggplot2で描画するとき、lapplyを使ってgeom_functionレイヤーを作成し、ggplotオブジェクトに足していく方法が使えます。
例
ggplot2を使用します。
設定
正規分布の母数(平均\(\mu\)と標準偏差\(\sigma\))の組み合わせを以下のように3種類設定します。
- \(\mu = 0, \sigma = 1\)
- \(\mu = -1, \sigma = 0.5\)
- \(\mu = 2, \sigma = 2\)
df <- data.frame(mu = c(0, -1, 1), sigma = c(1, 0.5, 2))描画
描画します。lapply関数でgeom_functionのレイヤーのリストを返しています。aes関数のcolour引数で凡例に示す文字列を設定しています。
ggplot(data.frame(x = c(-5, 5)), aes(x = x)) +
  lapply(1:nrow(df), function(i) {
    geom_function(
      fun = dnorm,
      aes(colour = paste0("μ=", df$mu[i], ", σ=", df$sigma[i])),
      args = list(mean = df$mu[i], sd = df$sigma[i])
    )
  }) +
  labs(x = "x", y = "Probability density", colour = "Parameters") +
  theme_bw() +
  theme(legend.position = c(0.95, 0.95),
        legend.justification = c(1, 1))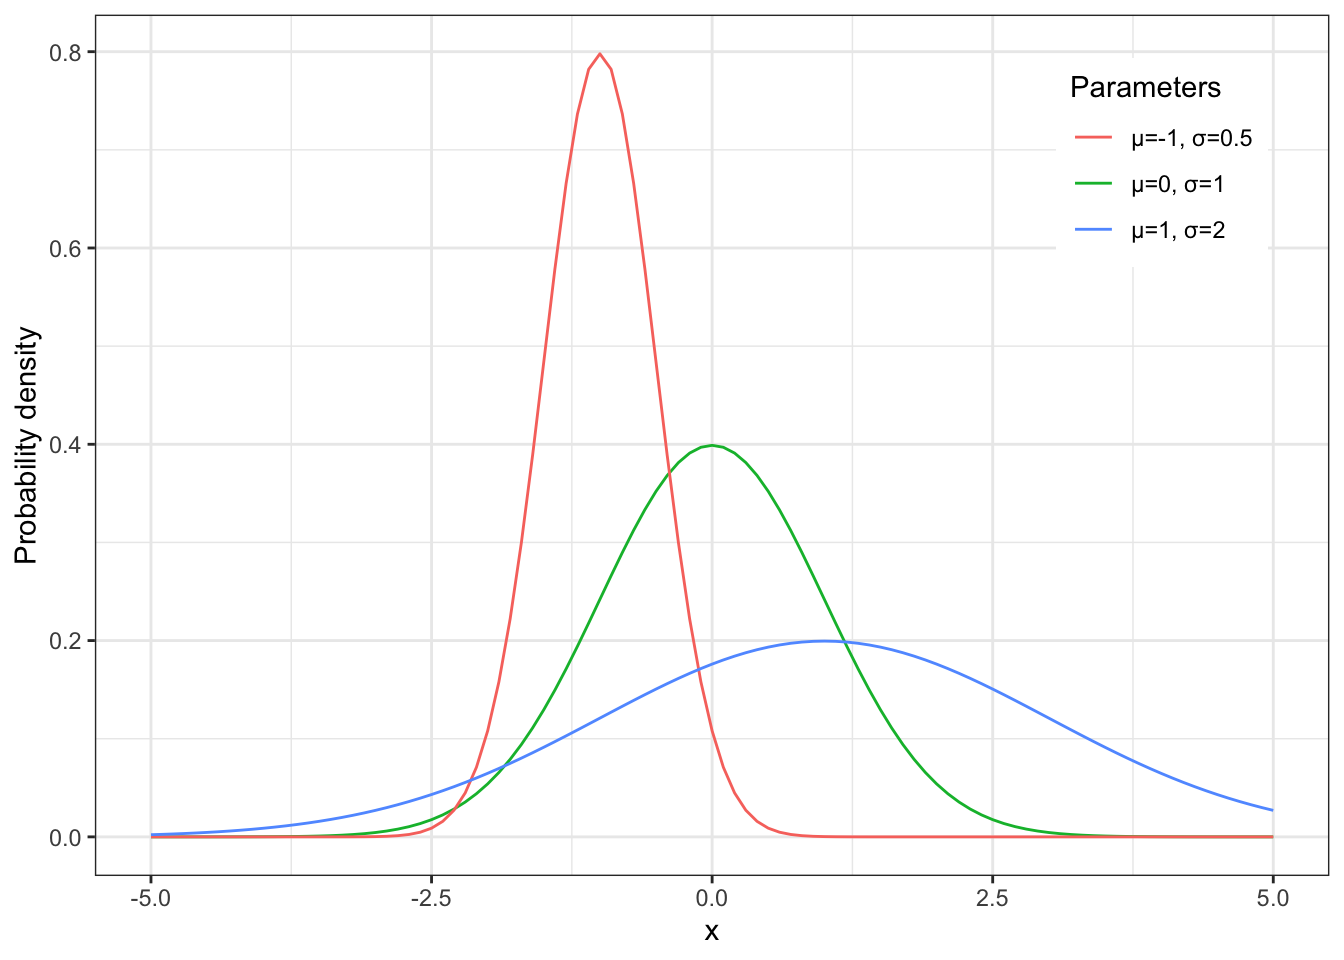
補足
これは、ggplot2のレイヤーをlistで与えることができるからです。以下の例ではlist型のlayersオブジェクトの要素にレイヤーをあてはめ、layersをggplotオブジェクトに追加して図を作成しています。
set.seed(123)

x <- seq(-4, 4, 0.1)
y <- rnorm(length(x), mean = 0.5 * x, sd = 0.3)
df <- data.frame(x = x, y = y)

layers <- list(
  geom_point(size = 1.5, colour = "red"),
  geom_smooth(method = "lm", colour = "blue", formula = y ~ x),
  scale_x_continuous(limits = c(-4, 4), breaks = seq(-4, 4, 2)),
  scale_y_continuous(limits = c(-4, 4), breaks = seq(-4, 4, 2)),
  coord_fixed(),
  theme_bw()
)

ggplot(df, aes(x = x, y = y)) +
  layers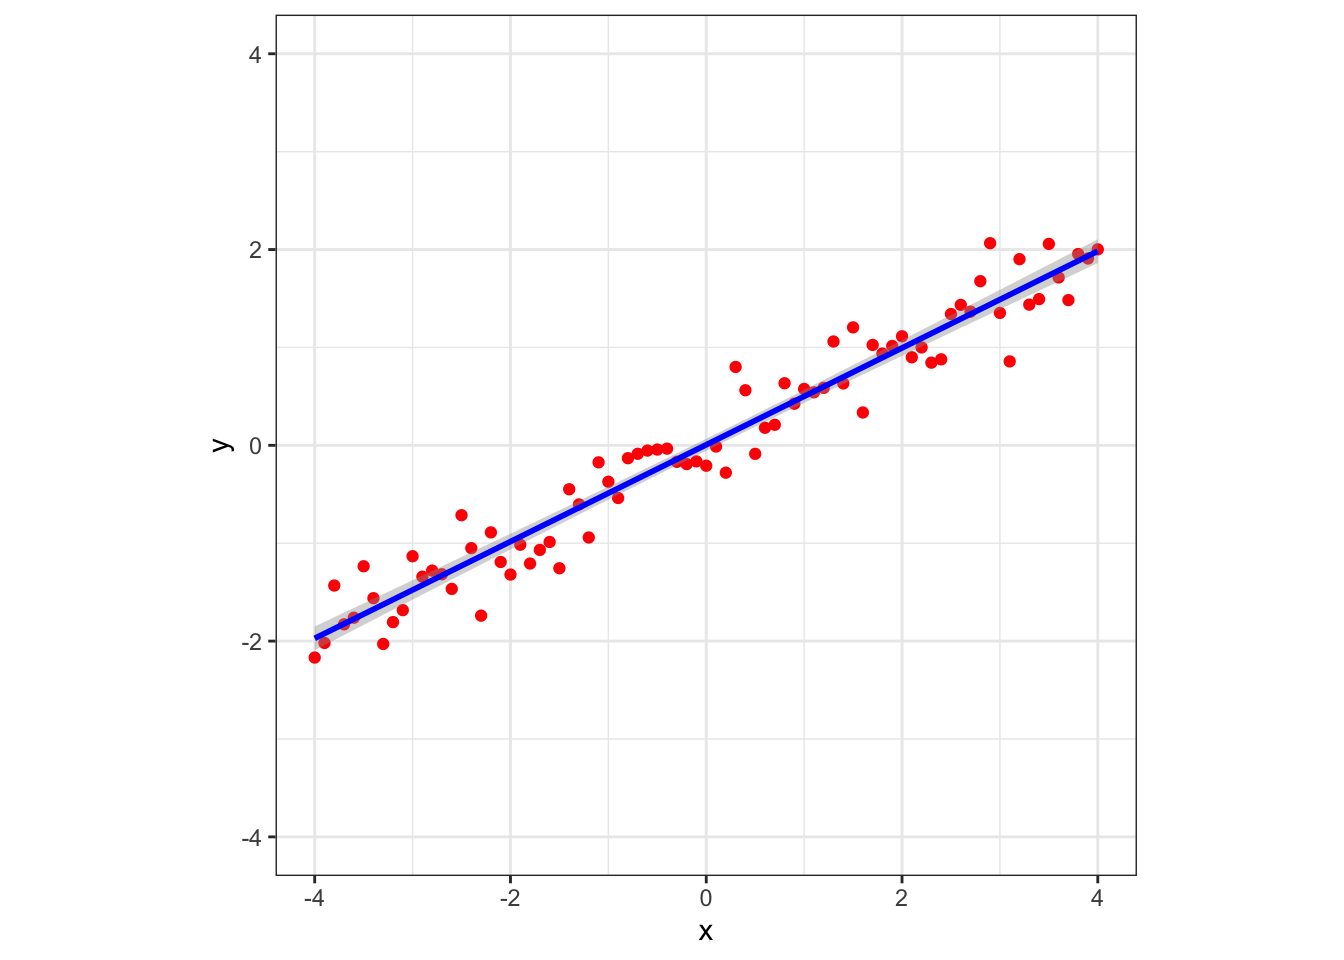
検索してみると、niszetさんの日記「(R) ggplot2で複数のレイヤーをlistにして一気に足す」にてこのことが書かれていました。