library(dendextend)
##
## ---------------------
## Welcome to dendextend version 1.19.1
## Type citation('dendextend') for how to cite the package.
##
## Type browseVignettes(package = 'dendextend') for the package vignette.
## The github page is: https://github.com/talgalili/dendextend/
##
## Suggestions and bug-reports can be submitted at: https://github.com/talgalili/dendextend/issues
## You may ask questions at stackoverflow, use the r and dendextend tags:
##   https://stackoverflow.com/questions/tagged/dendextend
##
##  To suppress this message use:  suppressPackageStartupMessages(library(dendextend))
## ---------------------
##
## Attaching package: 'dendextend'
## The following object is masked from 'package:stats':
##
##     cutree
library(circlize)
## ========================================
## circlize version 0.4.17
## CRAN page: https://cran.r-project.org/package=circlize
## Github page: https://github.com/jokergoo/circlize
## Documentation: https://jokergoo.github.io/circlize_book/book/
##
## If you use it in published research, please cite:
## Gu, Z. circlize implements and enhances circular visualization
##   in R. Bioinformatics 2014.
##
## This message can be suppressed by:
##   suppressPackageStartupMessages(library(circlize))
## ========================================クラスター分析の結果の表示では樹形図がよく用いられます。項目数が多い場合は、横に長くしないと項目のラベルが読みにくくなります。そういう場合のためかはよく知りませんが、円環状の樹形図を見ることがあります。そこでそのような樹形図をRで描画する例をメモしておきます。
参考: Circular dendrogram in R with circlize and dendexten
準備
円環状の樹形図の描画のため、dendextendパッケージとcirclizeパッケージを利用します。
データ
『みんなのR 第2版』の25章「クラスタリング」で使用されているワインのデータセットを利用しました。本にしたがって、Cultivar列は除外しています。
wineUrl <- "https://archive.ics.uci.edu/ml/machine-learning-databases/wine/wine.data"
wine <- readr::read_csv(
  wineUrl,
  col_names = c("Cultivar", "Alcohol", "Malic_acid",
                "Ash", "Alcalinity_of_ash", "Magnesium",
                "Total_phenols", "Flavanoids", "Nonflavanoid_phenols",
                "Proanthocyanins", "Color_intensity", "Hue",
                "OD280/OD315_of_diluted_wines", "Proline")
) |>
  dplyr::select(-Cultivar)
## Rows: 178 Columns: 14
## ── Column specification ────────────────────────────────────────────────────────
## Delimiter: ","
## dbl (14): Cultivar, Alcohol, Malic_acid, Ash, Alcalinity_of_ash, Magnesium, ...
##
## ℹ Use `spec()` to retrieve the full column specification for this data.
## ℹ Specify the column types or set `show_col_types = FALSE` to quiet this message.
読み込んだデータを確認します。
head(wine)
## # A tibble: 6 × 13
##   Alcohol Malic_acid   Ash Alcalinity_of_ash Magnesium Total_phenols Flavanoids
##     <dbl>      <dbl> <dbl>             <dbl>     <dbl>         <dbl>      <dbl>
## 1    14.2       1.71  2.43              15.6       127          2.8        3.06
## 2    13.2       1.78  2.14              11.2       100          2.65       2.76
## 3    13.2       2.36  2.67              18.6       101          2.8        3.24
## 4    14.4       1.95  2.5               16.8       113          3.85       3.49
## 5    13.2       2.59  2.87              21         118          2.8        2.69
## 6    14.2       1.76  2.45              15.2       112          3.27       3.39
## # ℹ 6 more variables: Nonflavanoid_phenols <dbl>, Proanthocyanins <dbl>,
## #   Color_intensity <dbl>, Hue <dbl>, `OD280/OD315_of_diluted_wines` <dbl>,
## #   Proline <dbl>
階層型クラスタリング
hclust関数を使用して、UPGMA(群平均法)により階層型クラスタリングをおこないます。
wine_dend <- hclust(dist(wine), method = "average") |>
 as.dendrogram()
円環状樹形図の描画
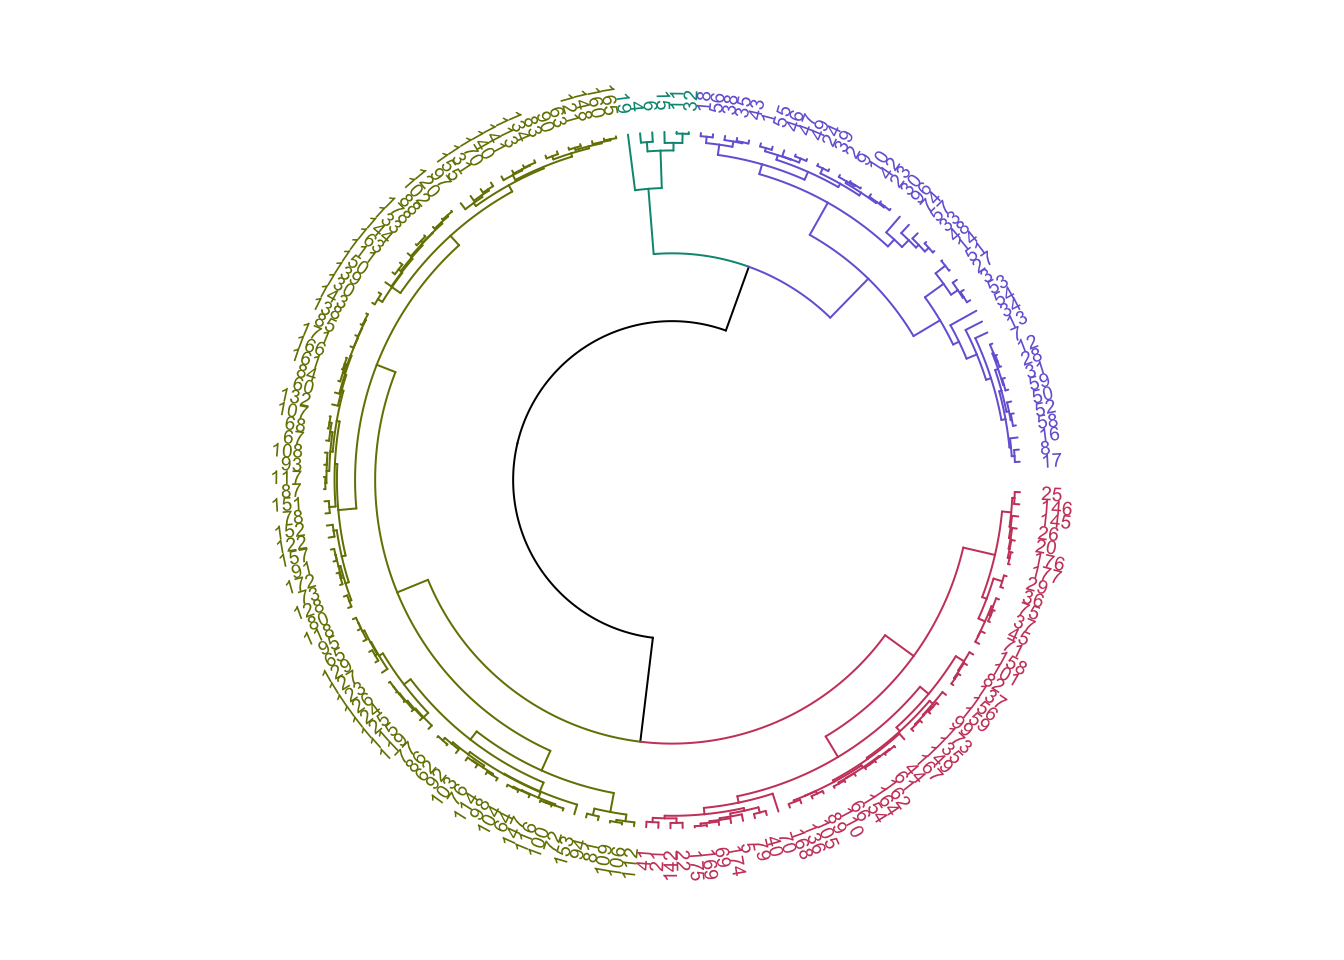
circlize_dendrogram関数を使用して円環状の樹形図を描画します。その前に、color_branches関数とcolor_labels関数を使用して、4つのクラスターに色付けするよう指定しています。また、set("labels_cex", 0.6)でラベルの文字サイズを調整しています。set関数では、そのほかにもいろいろ細かな設定をおこなえます。
wine_dend |>
  color_branches(k = 4) |>
  color_labels(k = 4) |>
  set("labels_cex", 0.6) |>
  circlize_dendrogram()